Fig. 17.
Download original image
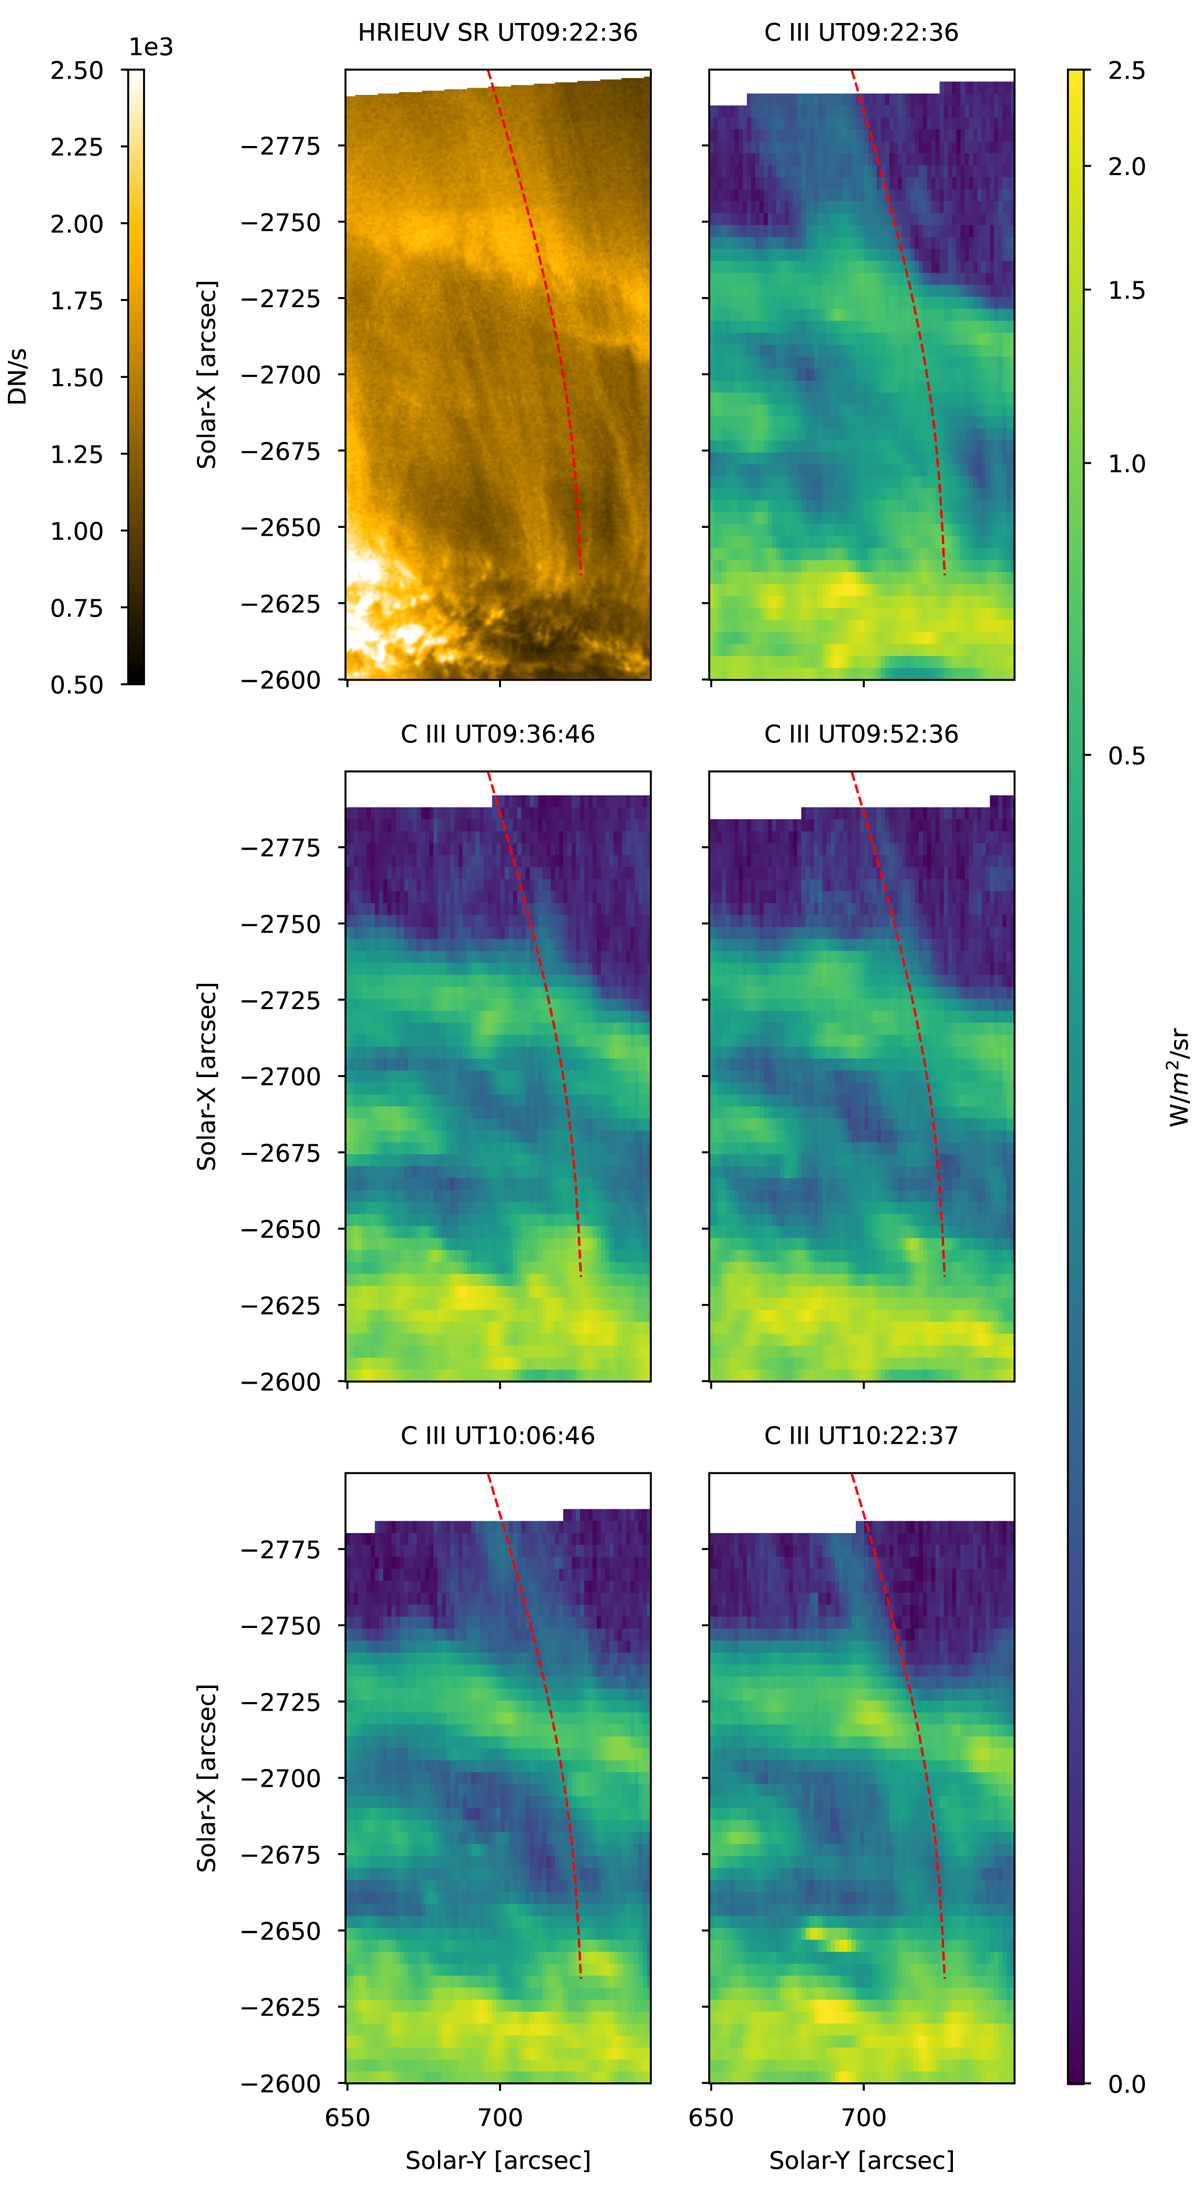
SPICE rasters in the C III line (log T = 4.8 K) over a region that overlaps with region 4 on April 1st. The FOV corresponds to the red rectangle to the east shown in Fig. 2 (bottom), and the overlaid red curves denote some of the rain paths seen with HRIEUV (see Figs. 10 and 11). The HRIEUV panel corresponds to an SR matching the time of the first SPICE raster (see the text for details), but preserving the HRIEUV spatial resolution. The SPICE panels show the total intensity integrated over the C III spectral line for each raster (the time is shown in the subtitle).
Current usage metrics show cumulative count of Article Views (full-text article views including HTML views, PDF and ePub downloads, according to the available data) and Abstracts Views on Vision4Press platform.
Data correspond to usage on the plateform after 2015. The current usage metrics is available 48-96 hours after online publication and is updated daily on week days.
Initial download of the metrics may take a while.