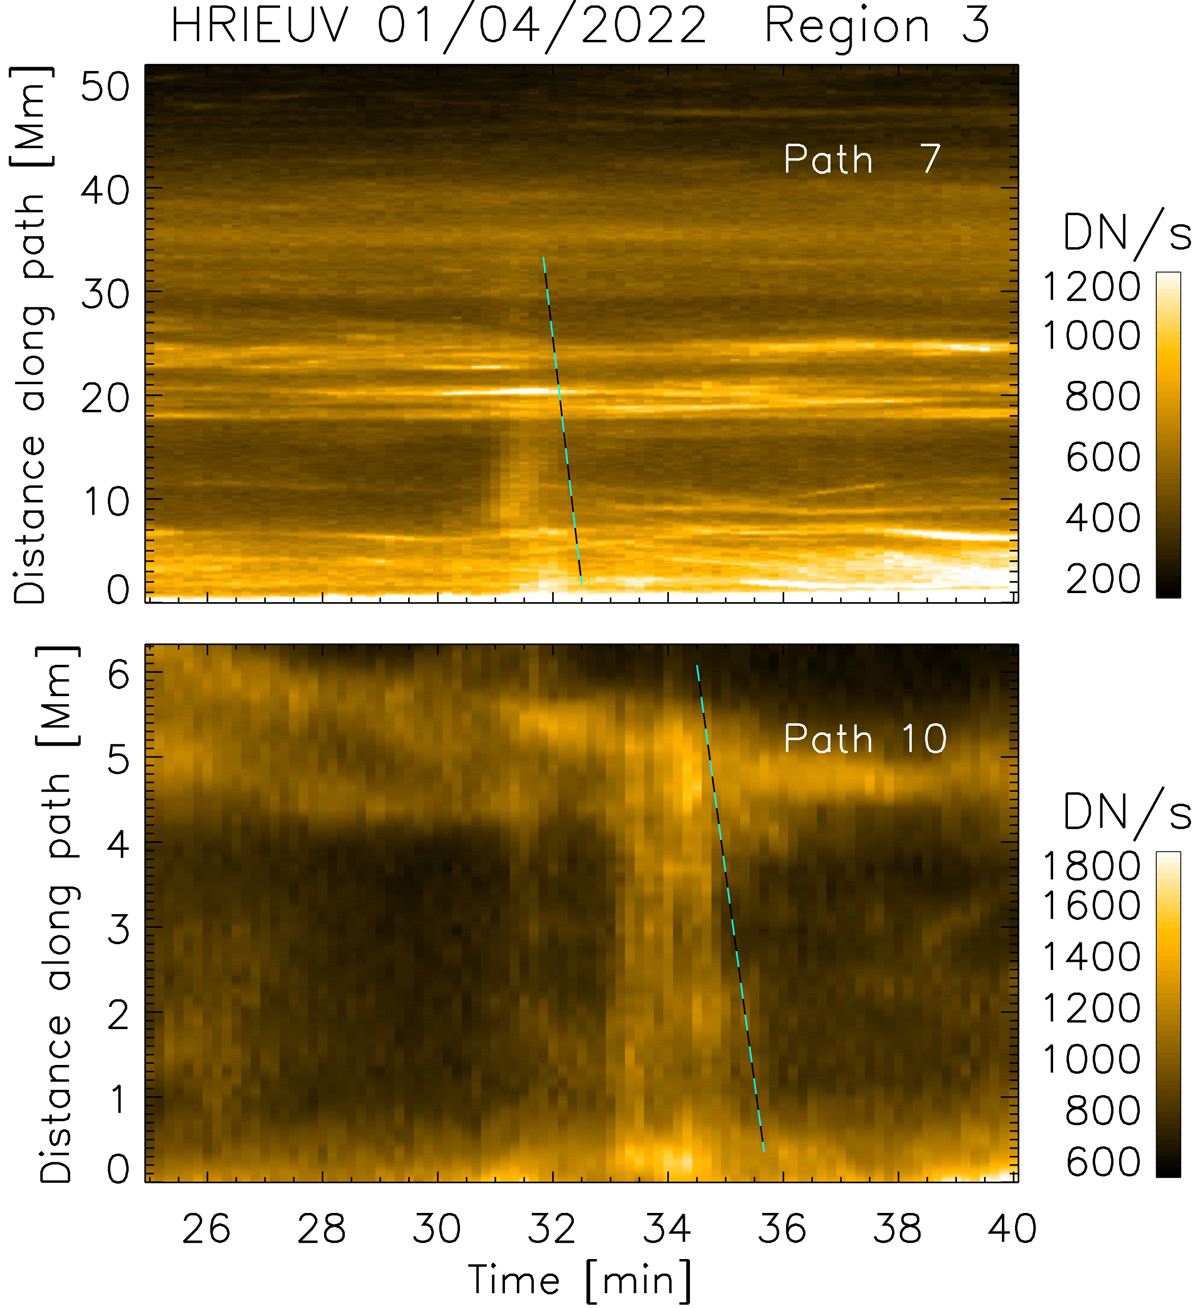
Fig. 15.
Download original image
Close-up of the time range t = [25, 45] min in the time-distance diagram of paths 7 (top) and 10 (bottom) shown in Fig. B.3. We note that the beginning of the brightening at t ≈ 33 min starts essentially at the same time along the path. The dashed cyan-black lines trace the outer envelope of the brightening, indicating a speed of ≈150 km s−1.
Current usage metrics show cumulative count of Article Views (full-text article views including HTML views, PDF and ePub downloads, according to the available data) and Abstracts Views on Vision4Press platform.
Data correspond to usage on the plateform after 2015. The current usage metrics is available 48-96 hours after online publication and is updated daily on week days.
Initial download of the metrics may take a while.