Fig. 14.
Download original image
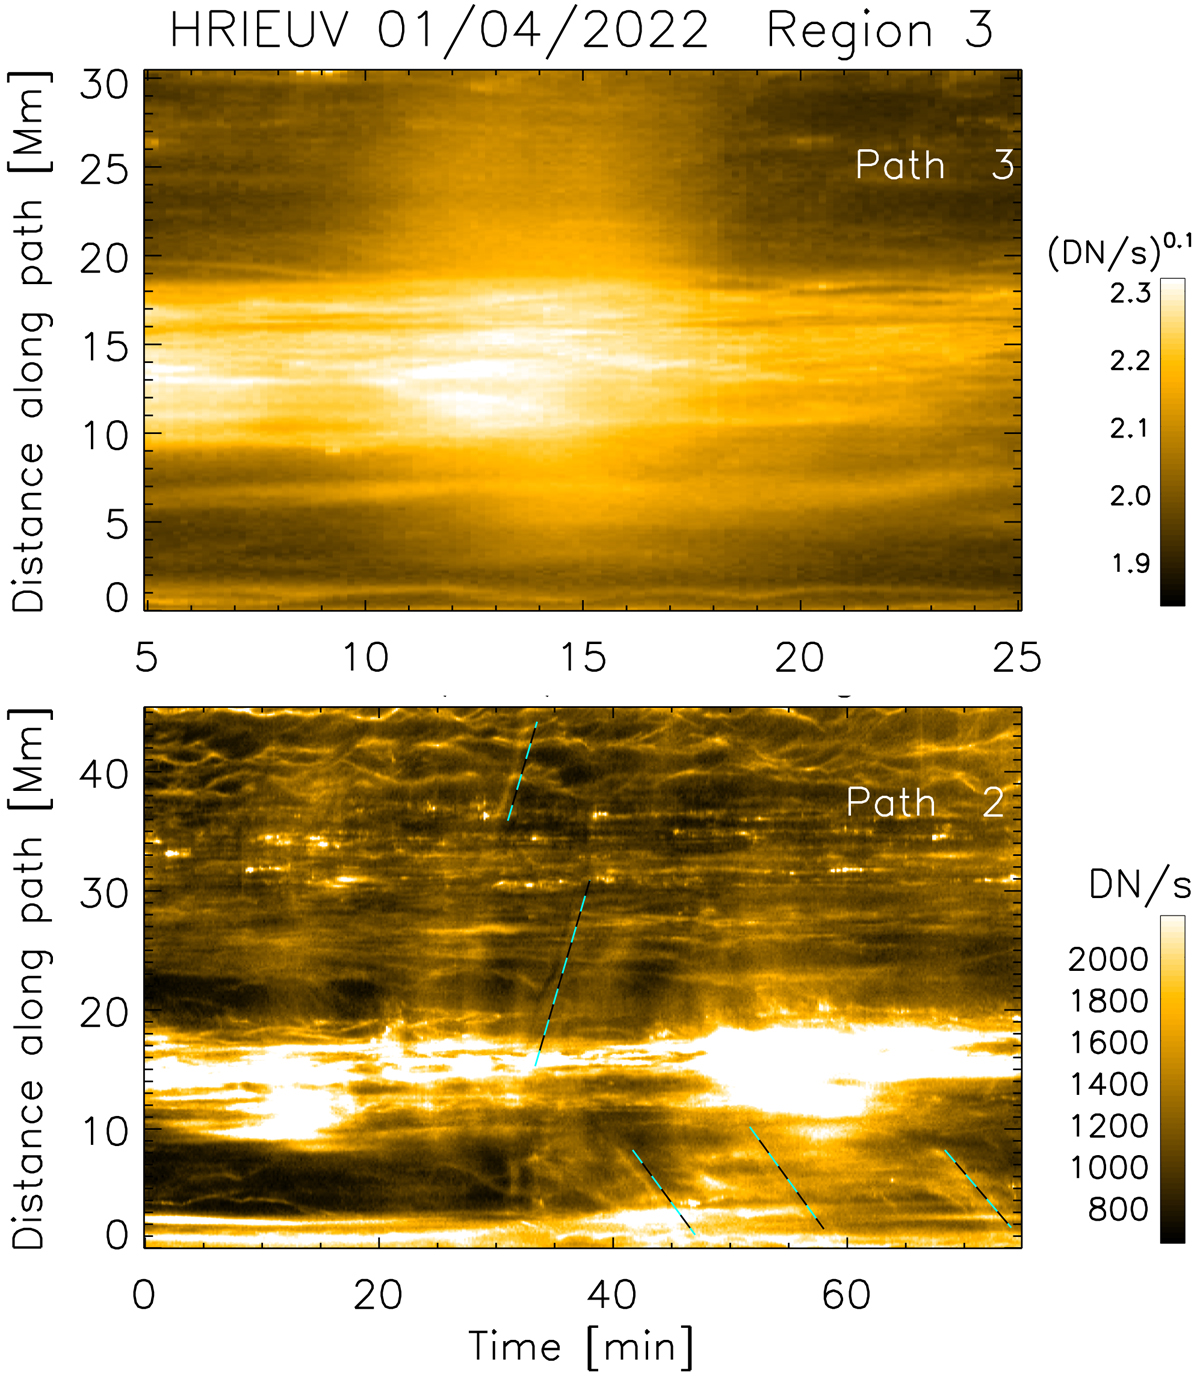
Loop brightening and downflows along the loop bundle in region 3. Top: loop brightening prior to a coronal rain event. This time-distance diagram (close-up of the time range t = [5, 25] min) corresponds to path 3 in region 3 on April 1st, which is shown in Fig. B.3. We note that the intensities have been scaled to the power of 0.1 to show the large intensity variation better. Bottom: time-distance along path 2 in the same loop bundle. The dashed white lines correspond to dark and bright tracks from coronal rain.
Current usage metrics show cumulative count of Article Views (full-text article views including HTML views, PDF and ePub downloads, according to the available data) and Abstracts Views on Vision4Press platform.
Data correspond to usage on the plateform after 2015. The current usage metrics is available 48-96 hours after online publication and is updated daily on week days.
Initial download of the metrics may take a while.