Fig. 1.
Download original image
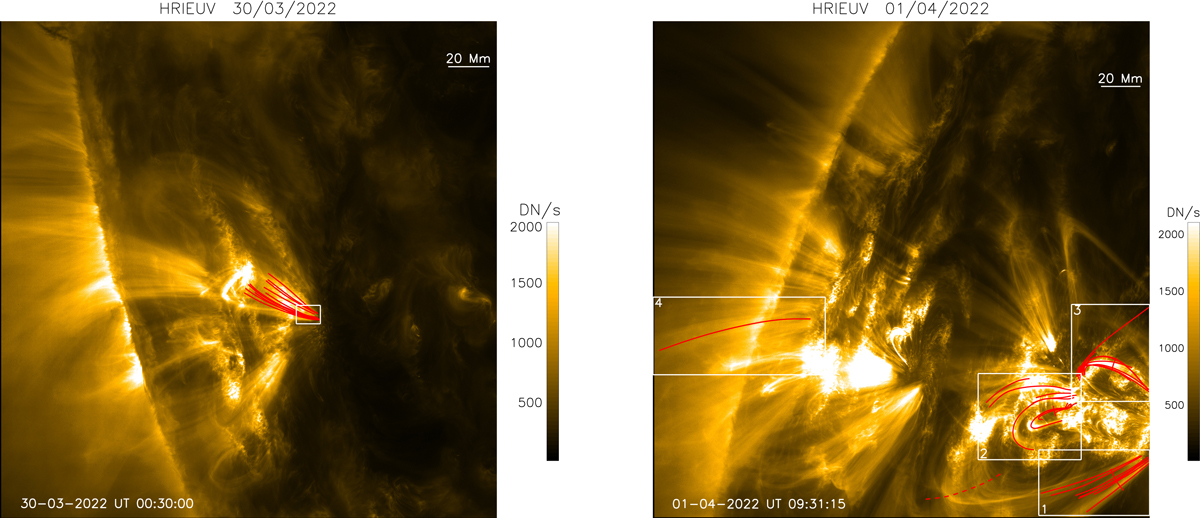
Full FOV of HRIEUV for the 2022 March 30 (left) and April 1st (right) datasets. The inner white rectangles show the sub-FOVs that are shown in later figures. The solid red curves denote the trajectories of some of the observed coronal rain clumps.
Current usage metrics show cumulative count of Article Views (full-text article views including HTML views, PDF and ePub downloads, according to the available data) and Abstracts Views on Vision4Press platform.
Data correspond to usage on the plateform after 2015. The current usage metrics is available 48-96 hours after online publication and is updated daily on week days.
Initial download of the metrics may take a while.