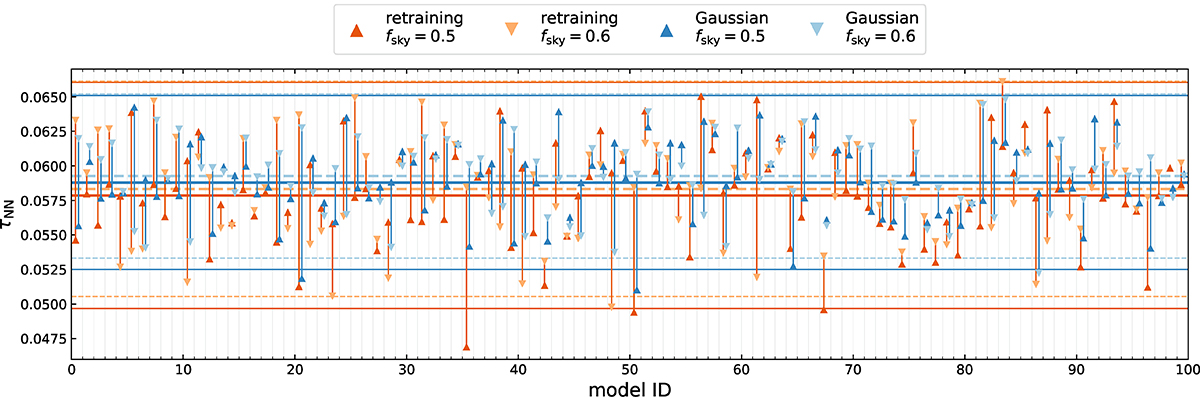
Fig. 9.
Download original image
NN predictions of τ from Planck 100+143 GHz data, resulting from training 100 equivalent models with different random initial weights and random seeds for training data, considering Gaussian two-channel training (blue tones) versus SRoll2 retraining (orange tones), and fsky = 0.5 (downward triangles) versus fsky = 0.6 (upward triangles). Colored triangle markers show the best-fit values for the single models and horizontal lines in the corresponding colors show the ensemble average of τ (middle) ± the 68% confidence interval (upper and lower lines).
Current usage metrics show cumulative count of Article Views (full-text article views including HTML views, PDF and ePub downloads, according to the available data) and Abstracts Views on Vision4Press platform.
Data correspond to usage on the plateform after 2015. The current usage metrics is available 48-96 hours after online publication and is updated daily on week days.
Initial download of the metrics may take a while.