Open Access
Fig. 6.
Download original image
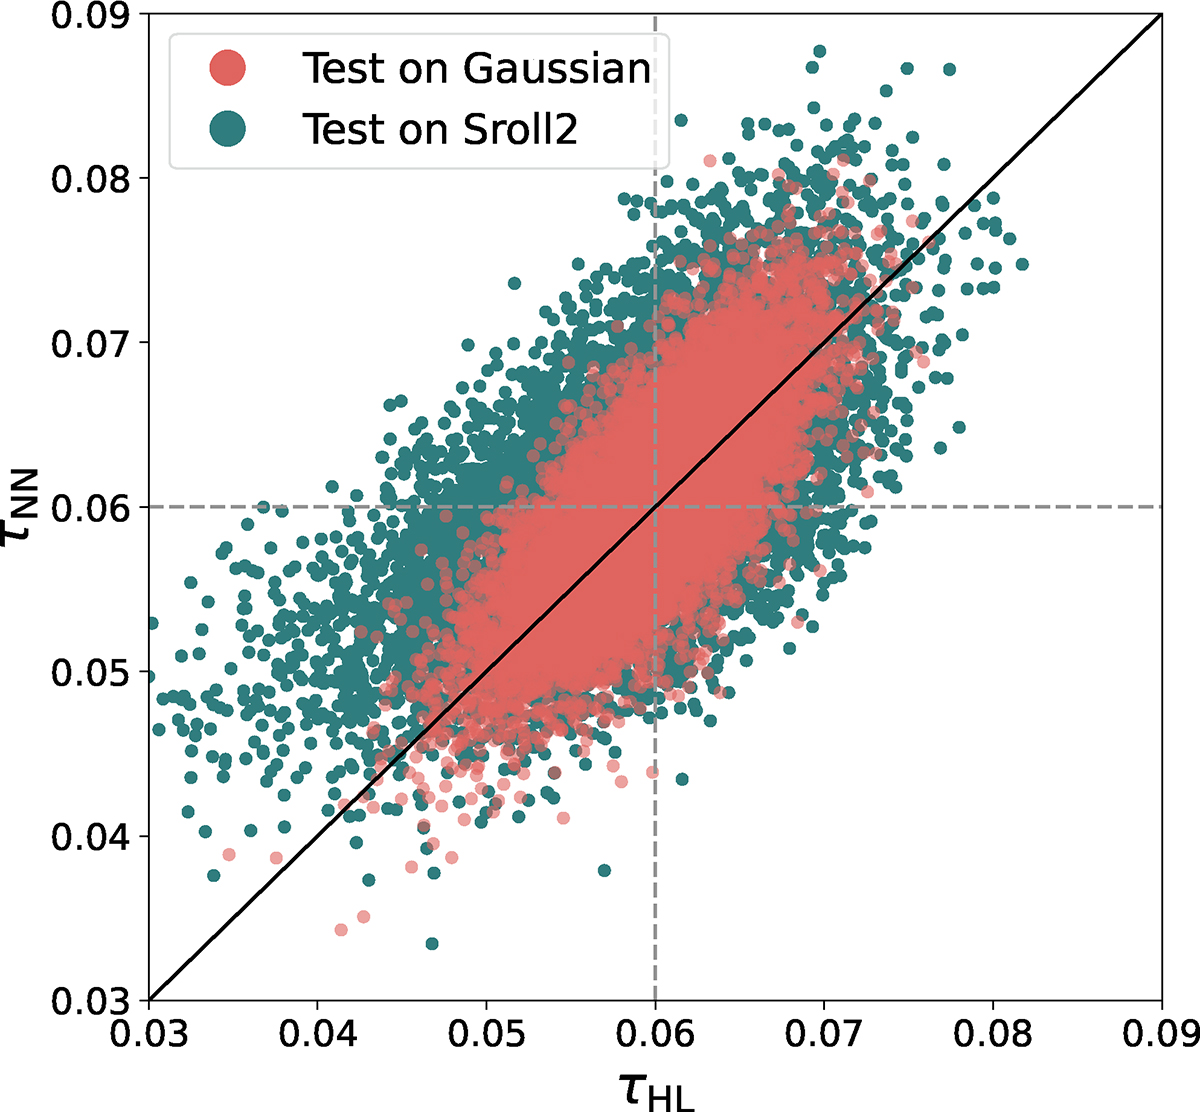
Per-simulation comparison between the HL likelihood estimate τ and the NN estimate τNN for a test set of 10 000 simulations realized with τ = 0.06. Gaussian simulations are shown in bright red, SRoll2 simulations in dark green. The correlation coefficients between both estimators are 76% (Gaussian) and 63% (SRoll2).
Current usage metrics show cumulative count of Article Views (full-text article views including HTML views, PDF and ePub downloads, according to the available data) and Abstracts Views on Vision4Press platform.
Data correspond to usage on the plateform after 2015. The current usage metrics is available 48-96 hours after online publication and is updated daily on week days.
Initial download of the metrics may take a while.