Fig. 6
Download original image
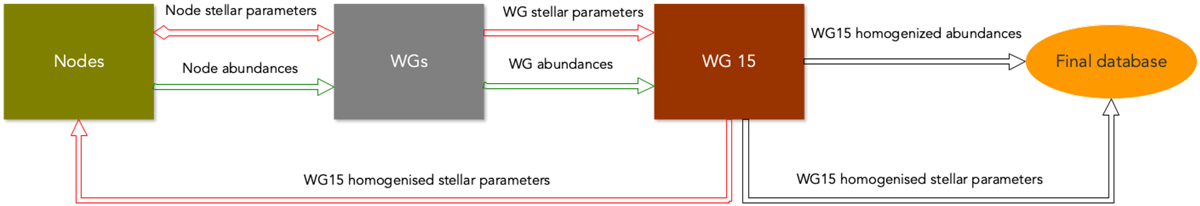
Schematic view of the GES analysis approach. Arrows in red mark the first cycle of analysis dedicated to the determination of the stellar parameters; the arrows in green indicate the analysis of abundances (with homogenised parameters), while in black we show the process of homogenisation and preparation of the final catalogue.
Current usage metrics show cumulative count of Article Views (full-text article views including HTML views, PDF and ePub downloads, according to the available data) and Abstracts Views on Vision4Press platform.
Data correspond to usage on the plateform after 2015. The current usage metrics is available 48-96 hours after online publication and is updated daily on week days.
Initial download of the metrics may take a while.