Open Access
Fig. 36
Download original image
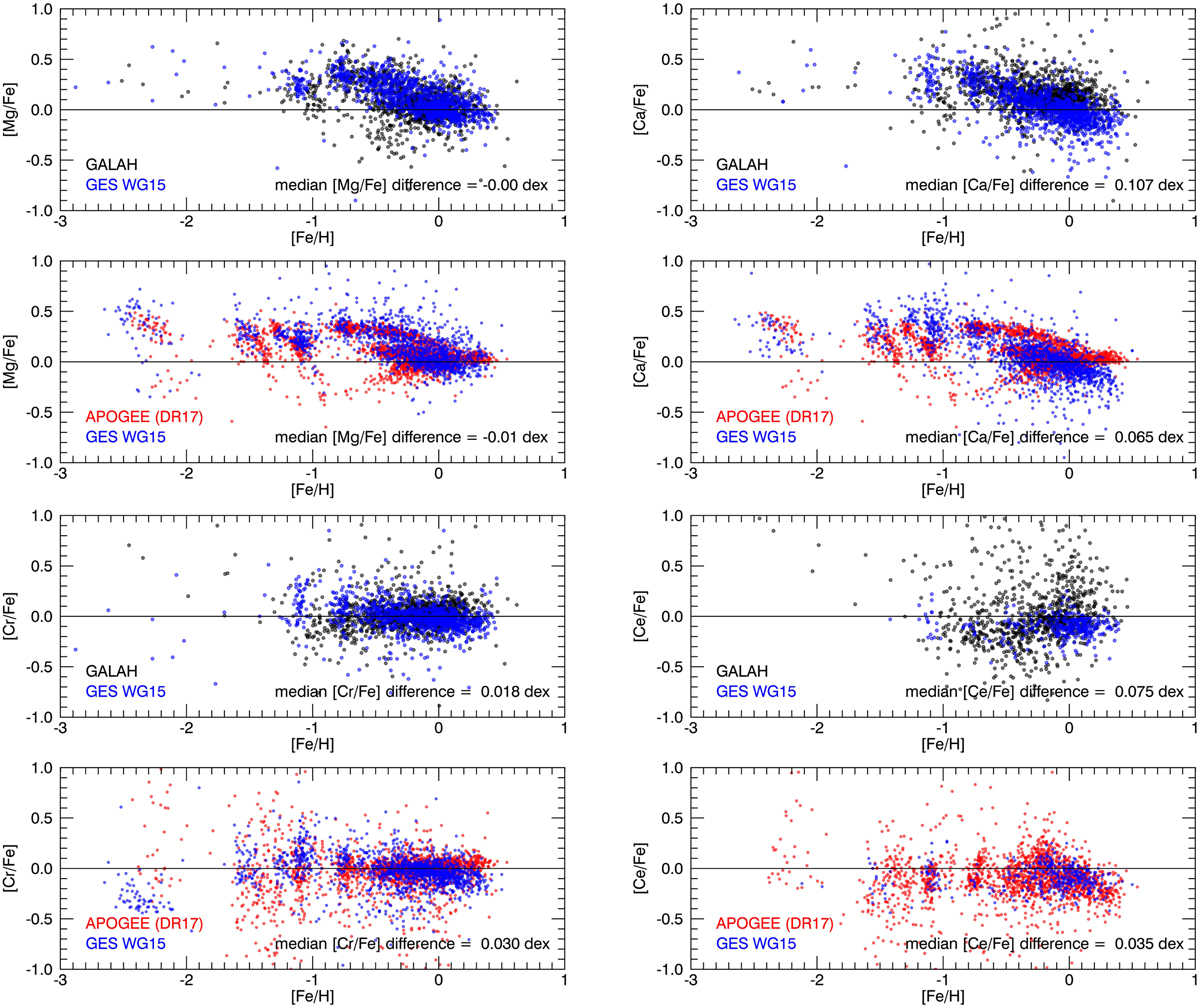
Comparison between WG15, GALAH, and APOGEE abundance ratios for the sample of stars in common. WG15 data are represented as blue circles. Red symbols represent APOGEE data and black symbols are the data from the GALAH survey
Current usage metrics show cumulative count of Article Views (full-text article views including HTML views, PDF and ePub downloads, according to the available data) and Abstracts Views on Vision4Press platform.
Data correspond to usage on the plateform after 2015. The current usage metrics is available 48-96 hours after online publication and is updated daily on week days.
Initial download of the metrics may take a while.