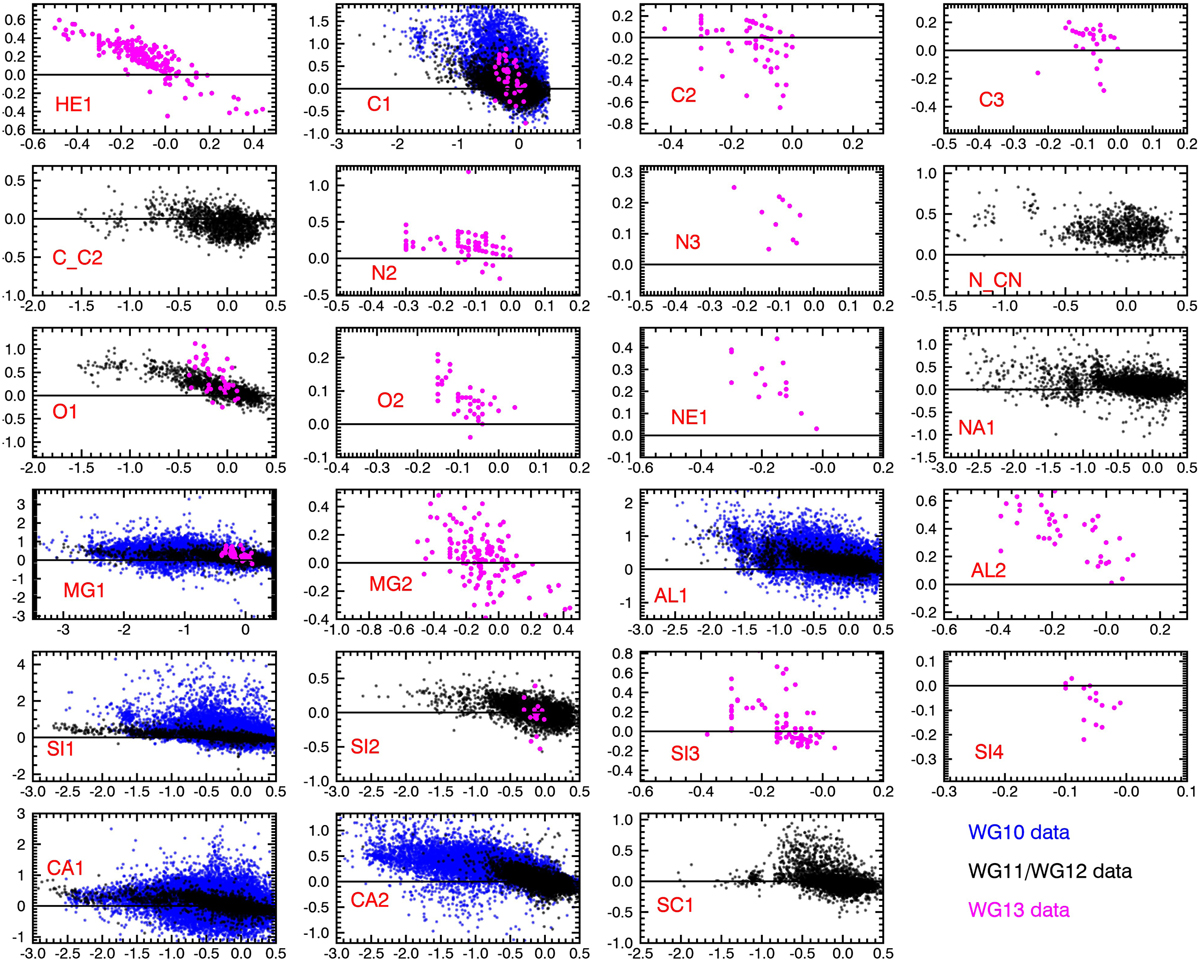
Fig. 20
Download original image
Abundance ratios [X/H] versus [Fe/H] for all the elements analysed in GES (except Li). The results of WG10 are represented by blue circles, those of WG11 and WG12 are shown as black circles, and WG13 results are represented by magenta circles. C_C2 are carbon abundances from C2 molecular bands and N_CN are nitrogen abundances from CN molecular bands.
Current usage metrics show cumulative count of Article Views (full-text article views including HTML views, PDF and ePub downloads, according to the available data) and Abstracts Views on Vision4Press platform.
Data correspond to usage on the plateform after 2015. The current usage metrics is available 48-96 hours after online publication and is updated daily on week days.
Initial download of the metrics may take a while.