Open Access
Fig. 13
Download original image
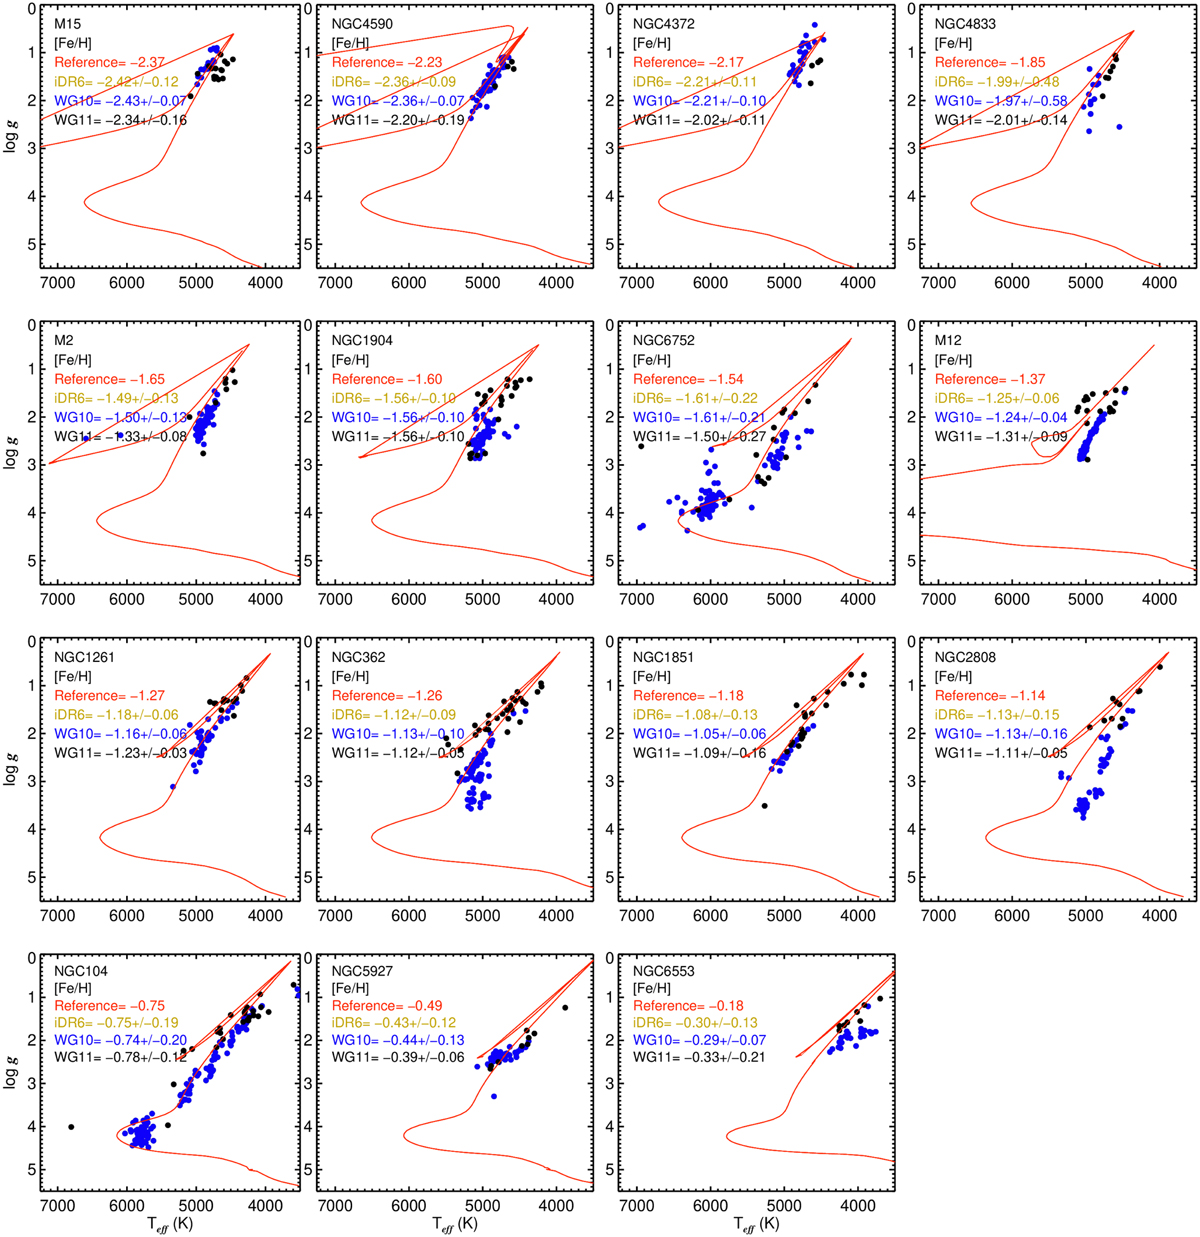
Kiel diagram for each of the 15 globular clusters in iDR6 shown as increasing in metallicity from left to right. An isochrone at the reference values of age and metallicity for each globular cluster is displayed. The results are separated by WG: WG11 in black and WG10 in blue.
Current usage metrics show cumulative count of Article Views (full-text article views including HTML views, PDF and ePub downloads, according to the available data) and Abstracts Views on Vision4Press platform.
Data correspond to usage on the plateform after 2015. The current usage metrics is available 48-96 hours after online publication and is updated daily on week days.
Initial download of the metrics may take a while.