Open Access
Fig. 11
Download original image
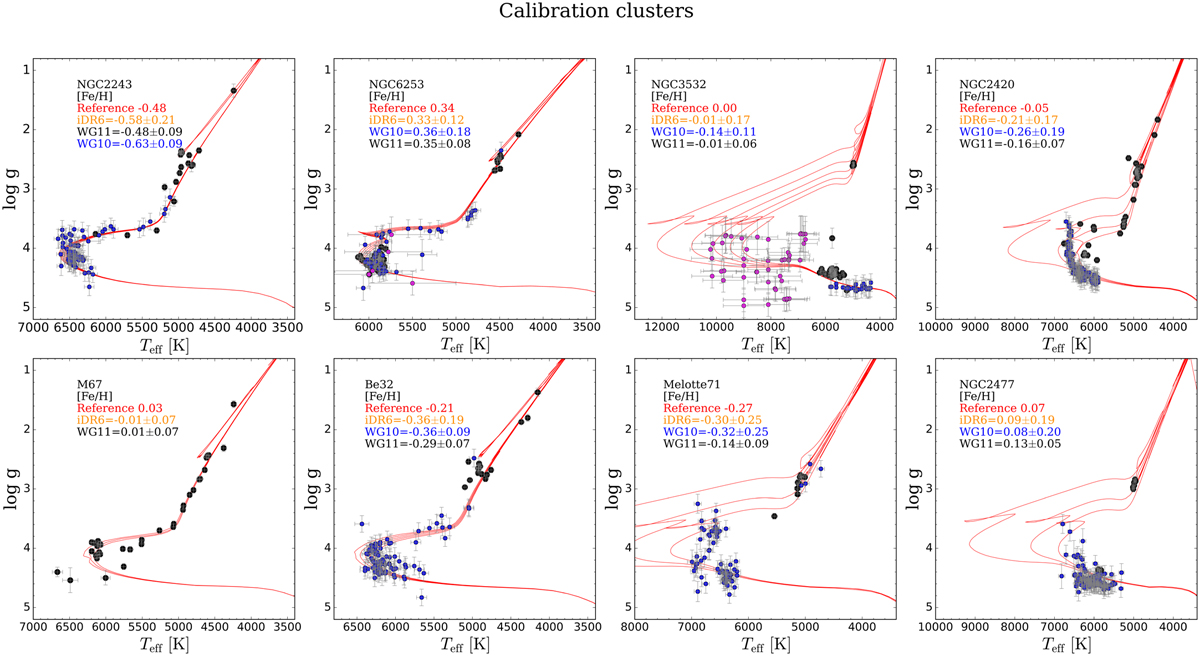
Kiel diagram of the calibration open clusters with homogenised data from WG10 (blue), WG11 (black) and WG13 (magenta) and the PARSEC isochrones for the age and metallicity of the clusters. In the plot, we include only stars with E_LOGG < 0.35.
Current usage metrics show cumulative count of Article Views (full-text article views including HTML views, PDF and ePub downloads, according to the available data) and Abstracts Views on Vision4Press platform.
Data correspond to usage on the plateform after 2015. The current usage metrics is available 48-96 hours after online publication and is updated daily on week days.
Initial download of the metrics may take a while.