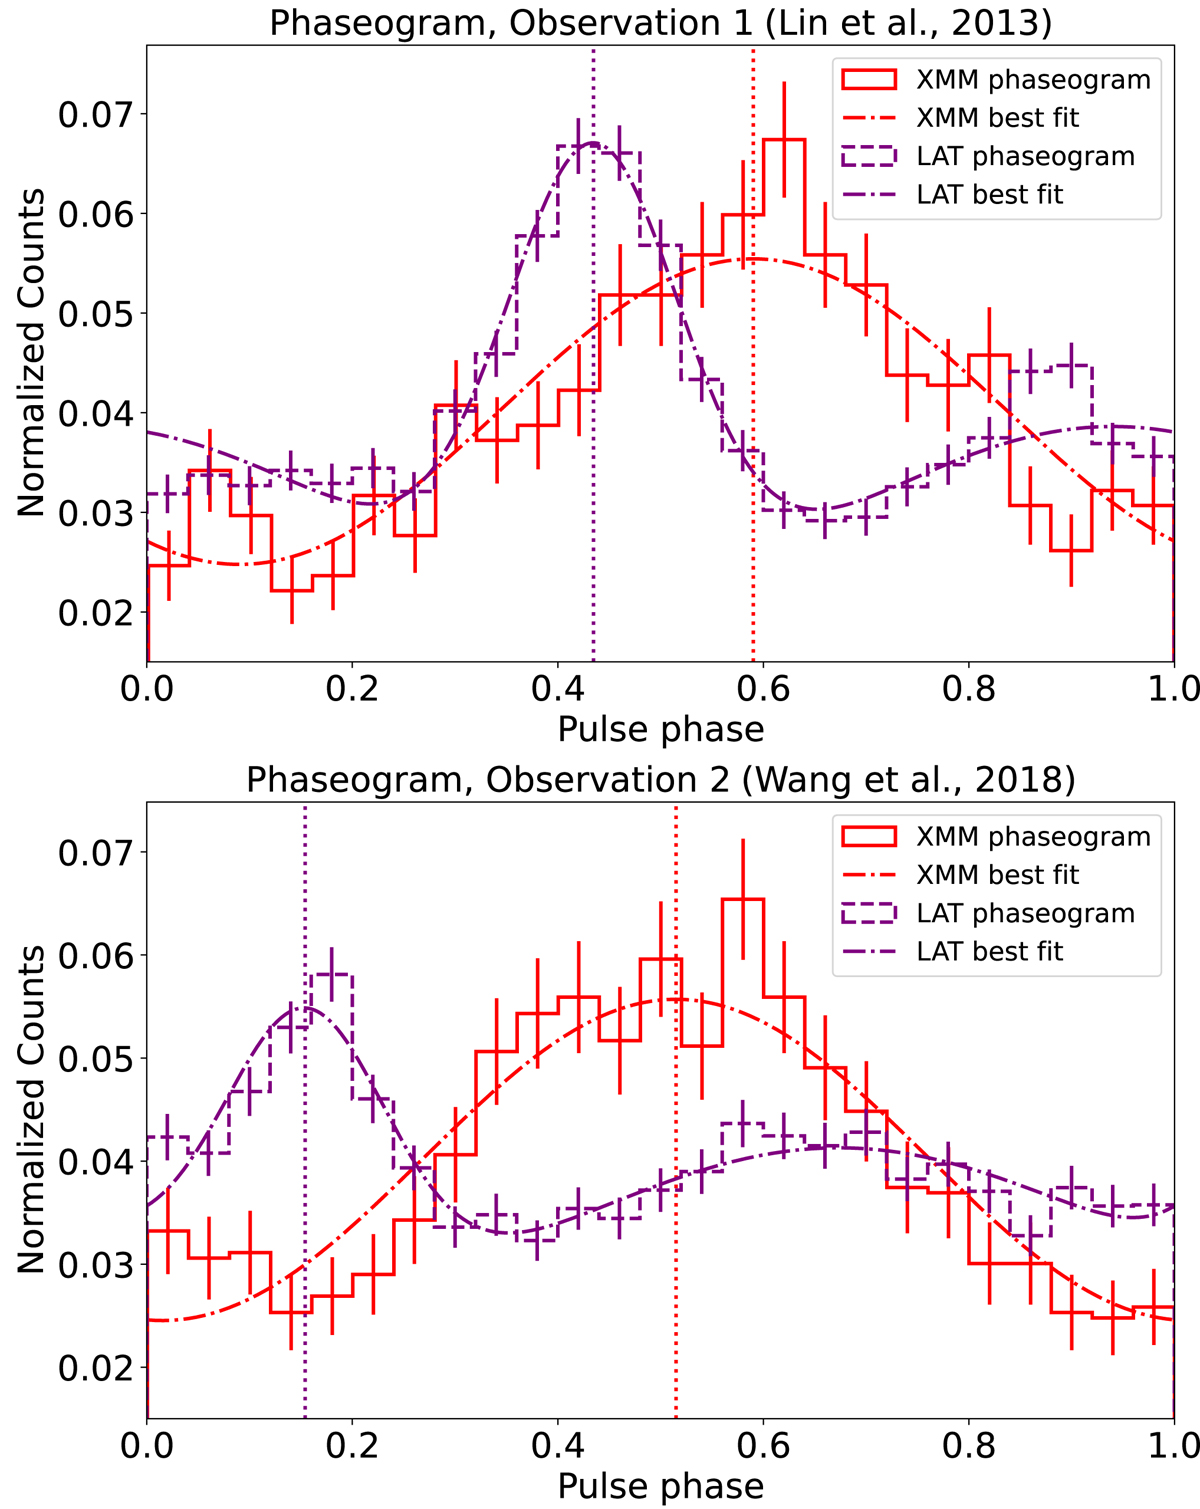
Fig. 3.
Download original image
Results of the timing checks that were performed based on the literature. The pulse profiles were obtained using the timing solutions published in Lin et al. (2013, top) and Wang et al. (2018, bottom). Both Fermi-LAT and XMM-Newton counts were normalised to 1. Statistical error bars are included for both phaseograms. The dotted vertical lines indicate the best-fit locations of the X-ray peak and higher γ-ray peak. No photon weights were applied.
Current usage metrics show cumulative count of Article Views (full-text article views including HTML views, PDF and ePub downloads, according to the available data) and Abstracts Views on Vision4Press platform.
Data correspond to usage on the plateform after 2015. The current usage metrics is available 48-96 hours after online publication and is updated daily on week days.
Initial download of the metrics may take a while.