Fig. 1.
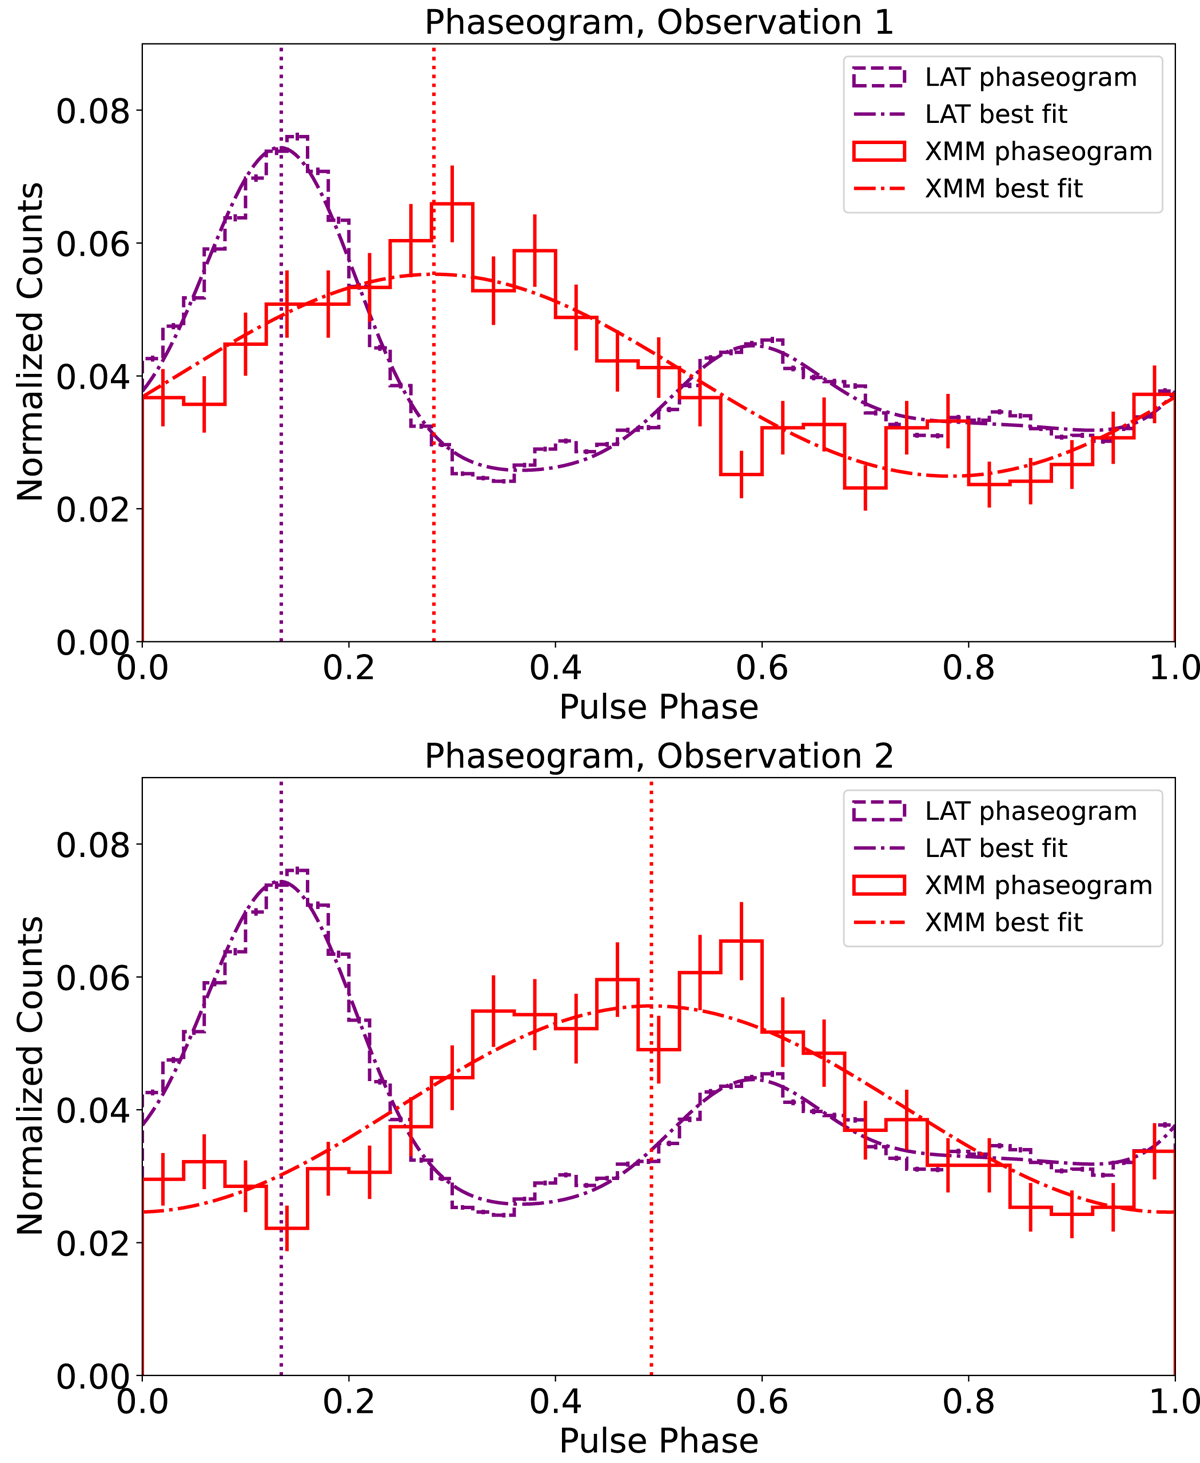
Download original image
Results from the full-mission timing analysis using best fits to the pulse profiles as described in Sect. 3.1. The top and bottom plots refer to the first and second XMM-Newton observations, respectively. Fermi-LAT counts were calculated using photon weights. XMM-Newton counts were normalized to 1, while Fermi-LAT counts were normalized to 2 for display purposes. Counts from the diffuse γ-ray background are not shown. Statistical error bars are included for both phaseograms. The dotted vertical lines indicate the best-fit locations of the X-ray peak and higher γ-ray peak.
Current usage metrics show cumulative count of Article Views (full-text article views including HTML views, PDF and ePub downloads, according to the available data) and Abstracts Views on Vision4Press platform.
Data correspond to usage on the plateform after 2015. The current usage metrics is available 48-96 hours after online publication and is updated daily on week days.
Initial download of the metrics may take a while.