Fig. 9.
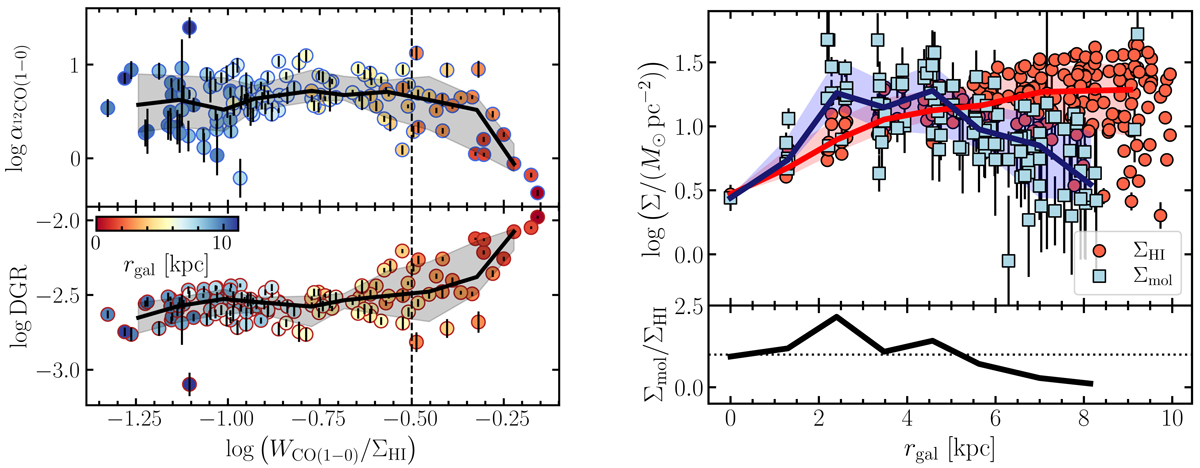
Download original image
DGR and α12CO(1−0) trends and atomic/molecular gas profiles Left: the trend of α12CO(1−0) and DGR as a function of the log(WCO/ΣH I), which roughly translates to the molecular-to-atomic gas fraction. The points indicate the individual solution pixels. The color indicates the galactocentric radius. The black line indicates the binned trend, and the dark-shaded region shows the 1σ scatter. The vertical dashed line is arbitrarily drawn and shows approximately beyond where the two parameters start to deviate from a flat trend. Right: radial profiles of ΣH I and Σmol at solution pixel scale resolution (∼2 kpc). The line indicates the radially binned values. The bottom panel shows the ratio of molecular to atomic gas mass surface density. The horizontal dotted line indicates unity between the molecular and atomic gas surface density.
Current usage metrics show cumulative count of Article Views (full-text article views including HTML views, PDF and ePub downloads, according to the available data) and Abstracts Views on Vision4Press platform.
Data correspond to usage on the plateform after 2015. The current usage metrics is available 48-96 hours after online publication and is updated daily on week days.
Initial download of the metrics may take a while.