Fig. 6.
Download original image
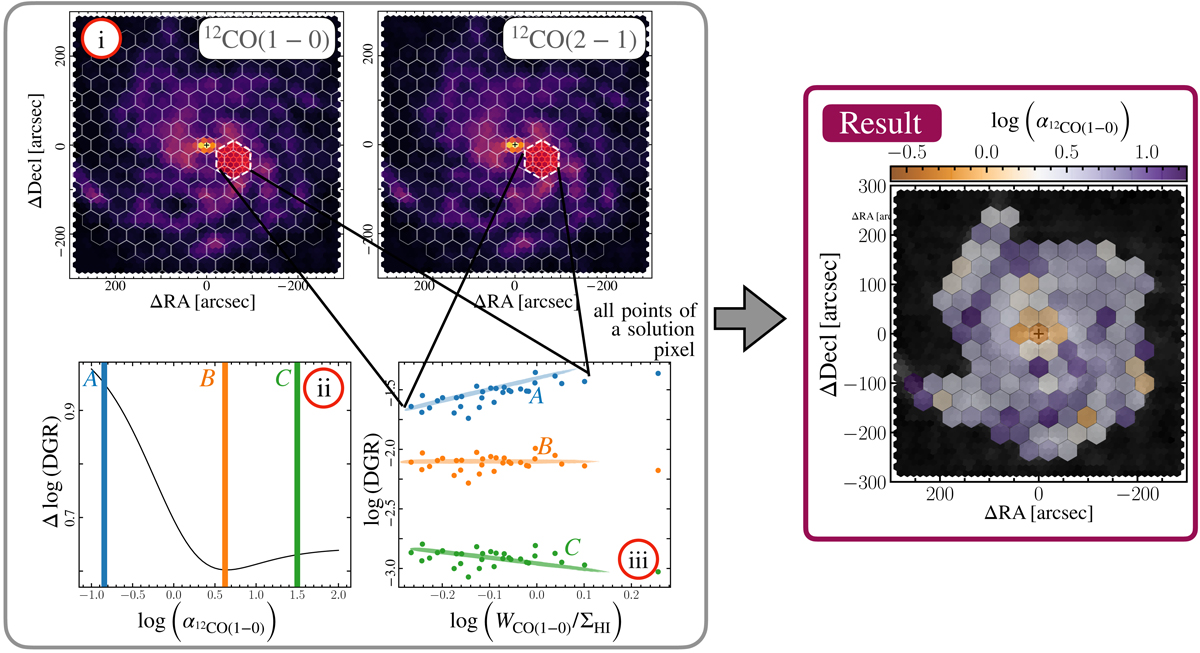
Solution pixel approach to estimate α12CO(1−0). Left: from the scatter minimization approach, described by Leroy et al. (2011) and Sandstrom et al. (2013), we obtain estimates of α12CO(1−0) and DGR. The top panels (i) show the hexagons that illustrate the individual solution pixels for both 12CO(1–0) and (2–1) transmission. The solution pixels consist of 37 underlying, half-beam spaced lines of sight. We note that the underlying hexagon tiling is meant to show the results in each solution pixel (the actual solution pixels have 40% overlap). In the maps, we highlight an individual solution pixel. We vary α12CO(1−0) and compute the DGR following Eq. (12). We select the value for which the variation in DGR is minimal. The bottom left panel (ii) shows the variation of the DGR as a function of different α12CO(1−0). The variation for the selected solution pixel is minimal for α12CO(1−0) labeled B. We perform this analysis for each solution pixel. The bottom right panel (iii) illustrates why the variance differs when changing α12CO(1−0). Here we combine all significant points from the solution pixel indicated in panel (i) from both CO lines. The black lines point to the solution pixel where the individual lines of sight are drawn from. We correct the 12CO(2–1) data with the average line ratio of the solution pixel. The panel illustrates the differences in DGR for three selected α12CO(1−0) (labeled A, B, and C). Based on the selection of α12CO(1−0) the DGR values will be positively or negatively correlated (as illustrated by the colored line, which is drawn schematically to guide the eye). Right: the resulting α12CO(1−0) value for each solution pixel based on the combined 12CO(1–0) and 12CO(2–1) integrated intensities.
Current usage metrics show cumulative count of Article Views (full-text article views including HTML views, PDF and ePub downloads, according to the available data) and Abstracts Views on Vision4Press platform.
Data correspond to usage on the plateform after 2015. The current usage metrics is available 48-96 hours after online publication and is updated daily on week days.
Initial download of the metrics may take a while.