Fig. 5.
Download original image
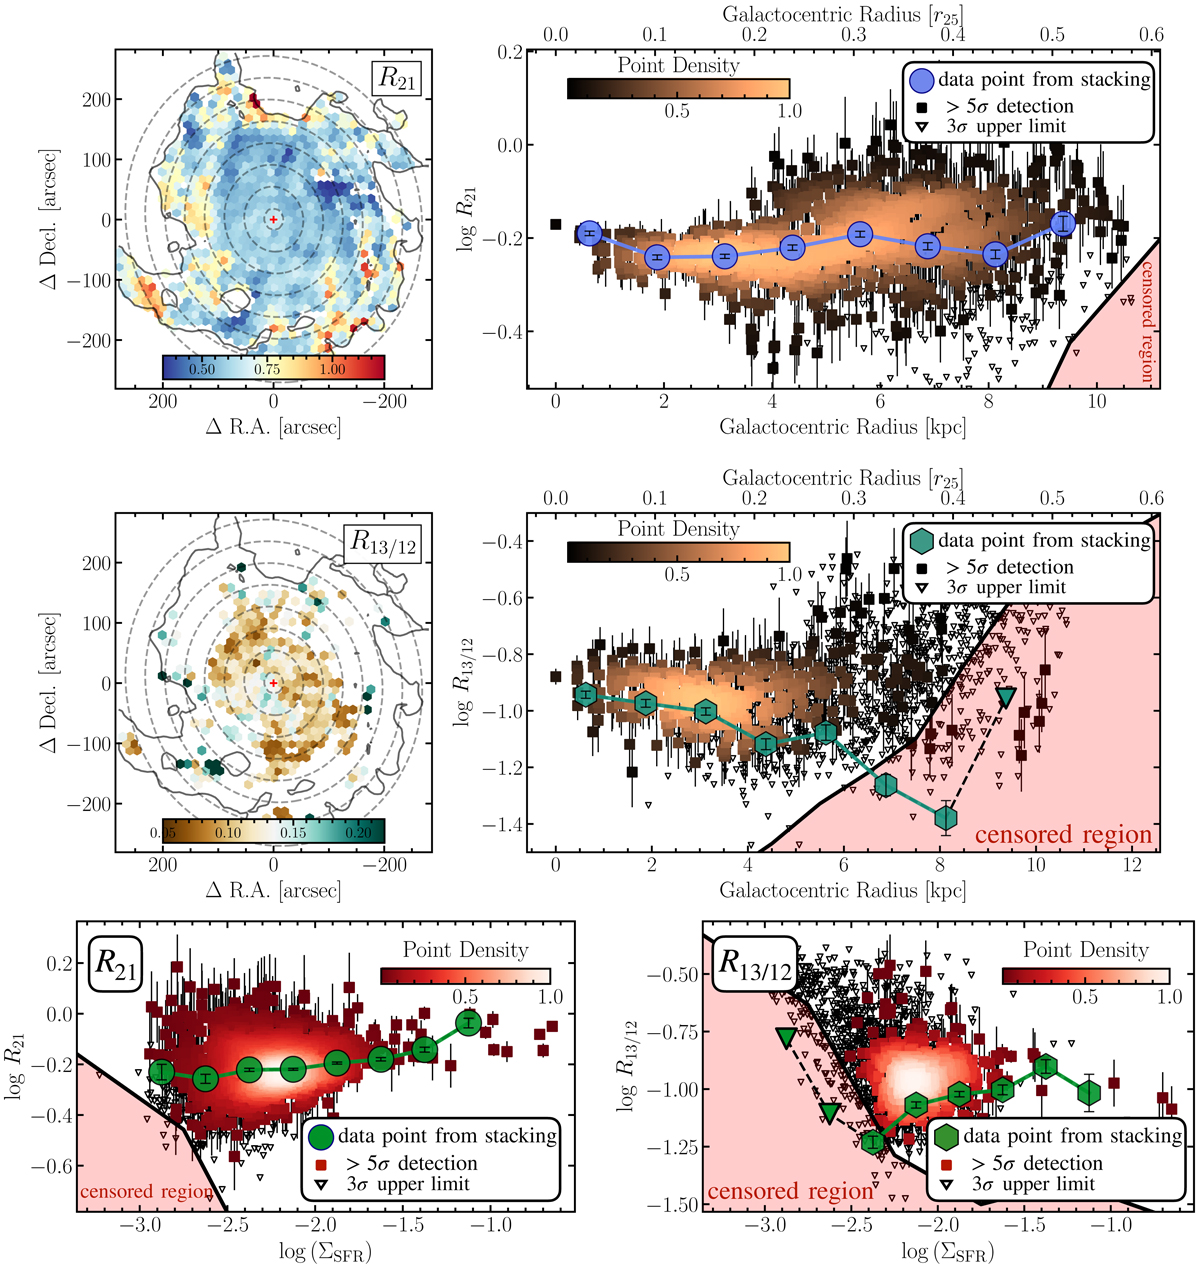
Spatial and radial variation of the CO line ratio. Top row shows the R21 line ratio while the central row shows the R13/12 line ratio. The maps (left top and middle panels) show the spatial distribution of the line ratios. The colored points show sightlines with 5σ in both integrated intensities. The 5σ contour of the 12CO(1–0) integrated intensity is shown by the solid contour. The dashed circles indicate the radial bins used for the stacking. The radial plots (right panels) show the radial trends of the line ratios. The panels in the bottom row show trends of the 12CO(2–1)/(1–0) (R21) ratio (left) and the 13CO/12CO(1–0) ratio (R13/12) (right) with the SFR surface density. The ratio derived by the stacked line brightness is indicated by the larger blue or green symbols (see Appendix C for a brief description of the stacking technique). We note that because the S/N13CO(1–0) is significantly lower than for 12CO(1–0), and more lines of sights do not show a significant detection, the stacked points yield a lower R13/12. Triangles indicate 3σ upper limits. The uncertainty of the points is indicated, but it is generally smaller than the point size. The censored region applying to the individual lines of sight is shown by the red (1σ) shaded region. The region indicates where, due to the lower average sensitivity of one observation set, we do not expect to find significantly detected data points (i.e., the region where only one dataset will be significantly detected).
Current usage metrics show cumulative count of Article Views (full-text article views including HTML views, PDF and ePub downloads, according to the available data) and Abstracts Views on Vision4Press platform.
Data correspond to usage on the plateform after 2015. The current usage metrics is available 48-96 hours after online publication and is updated daily on week days.
Initial download of the metrics may take a while.