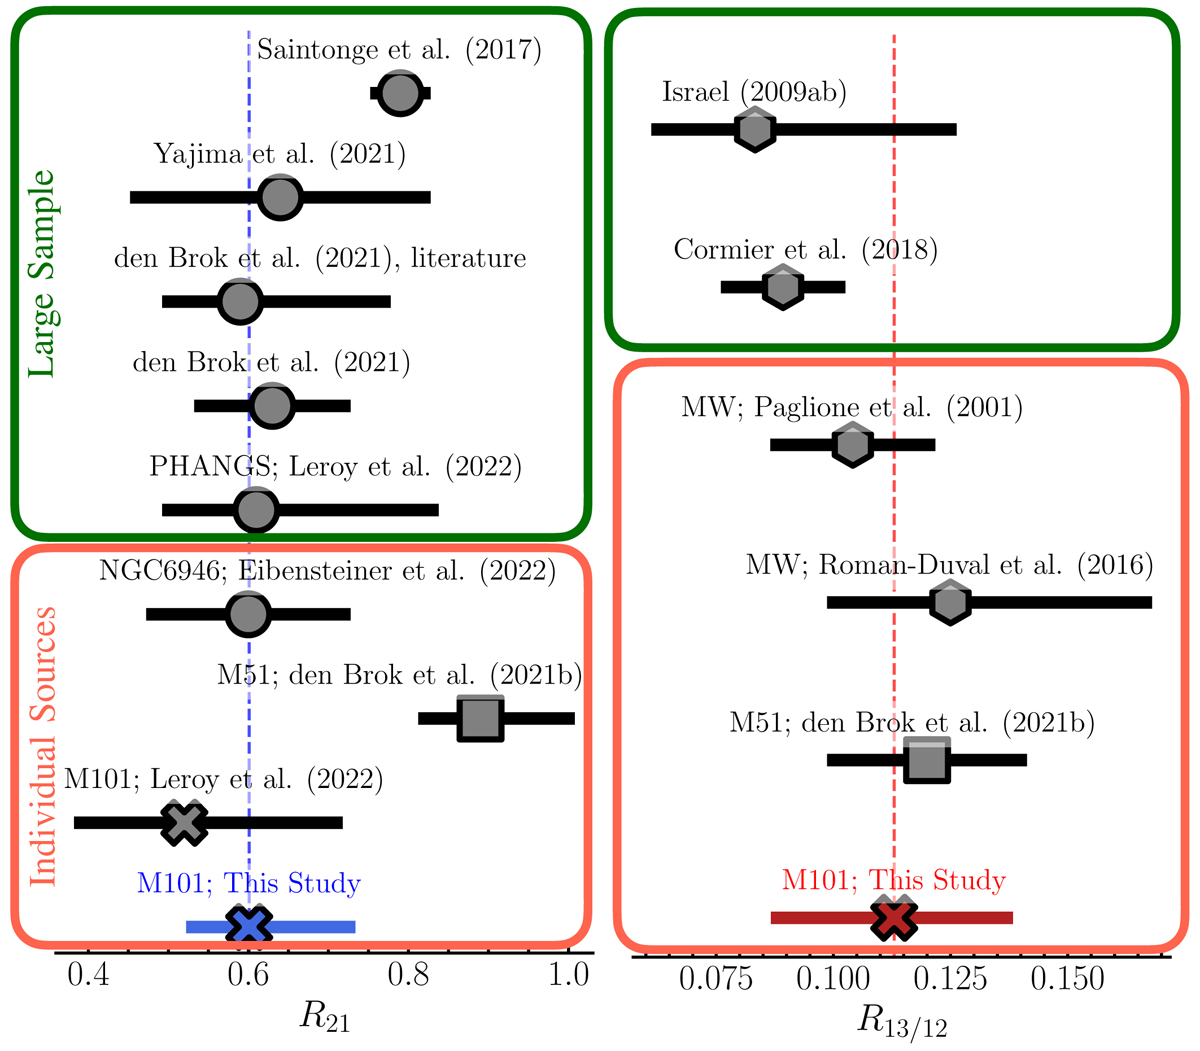
Fig. 4.
Download original image
CO line ratio comparison to literature values. We compare the average R21 and R13/12 values estimated from the distribution of the M101 data points to literature values. Errorbars indicate the 1σ distribution of sample values. If the literature value corresponds to the value for a specific galaxy, the source’s name is provided. Measurement for M101 indicated by the cross. The square symbol indicates the result from M51. Left: collection of R21 distributions. Right: the R13/12 distribution is shown. Our measurement agrees well with results for M51 and the Milky Way.
Current usage metrics show cumulative count of Article Views (full-text article views including HTML views, PDF and ePub downloads, according to the available data) and Abstracts Views on Vision4Press platform.
Data correspond to usage on the plateform after 2015. The current usage metrics is available 48-96 hours after online publication and is updated daily on week days.
Initial download of the metrics may take a while.