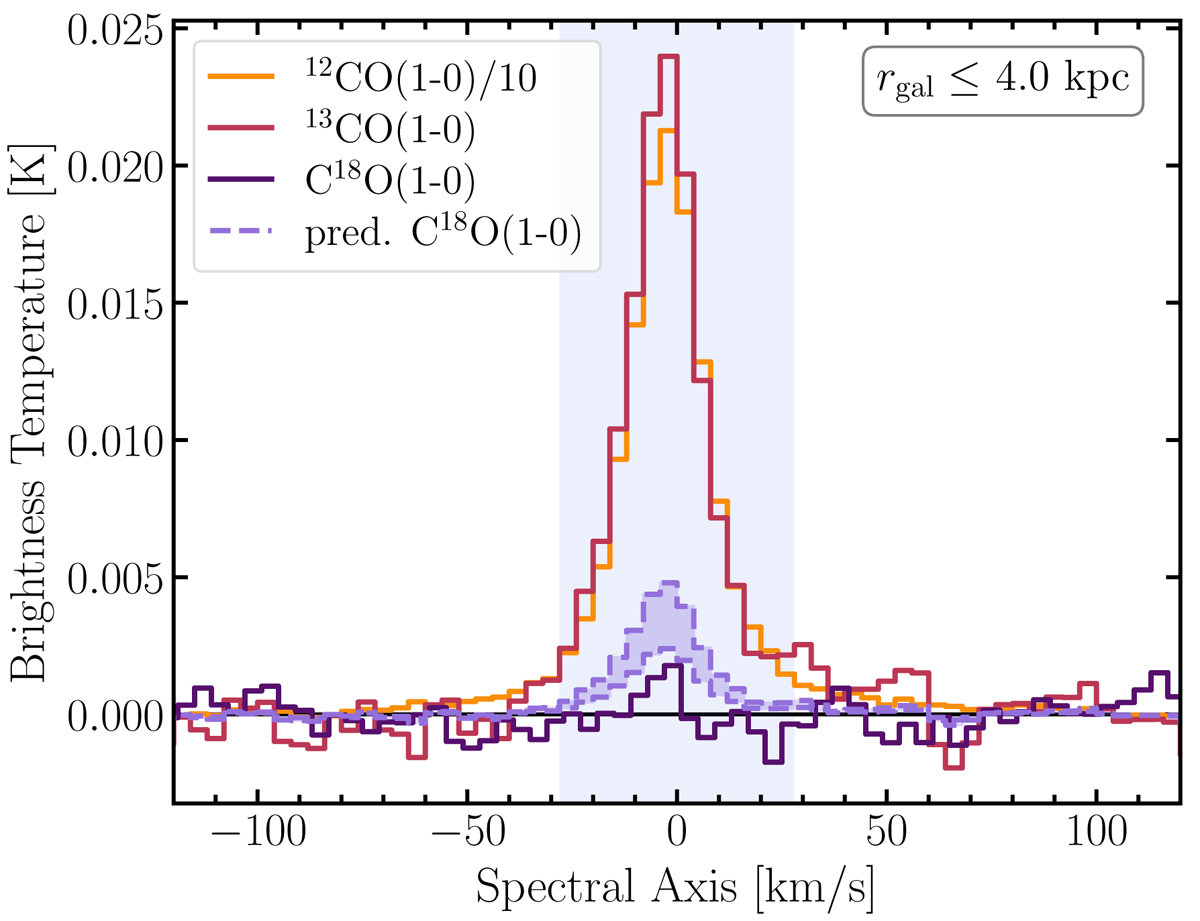
Fig. 3.
Download original image
Radially stacked CO spectra for rgal ≤ 4 kpc. We stack over the central 4 kpc. Furthermore, the predicted C18O(1–0) emission line is shown, based on the 13CO(1–0) emission line and assuming a line ratio of 0.2 > R18/13 > 0.1 (Jiménez-Donaire et al. 2017). The C18O(1–0) in M101 seems to be fainter than we would expect based on values from EMPIRE. The blue-shaded background indicates the line mask over which we integrate the spectrum.
Current usage metrics show cumulative count of Article Views (full-text article views including HTML views, PDF and ePub downloads, according to the available data) and Abstracts Views on Vision4Press platform.
Data correspond to usage on the plateform after 2015. The current usage metrics is available 48-96 hours after online publication and is updated daily on week days.
Initial download of the metrics may take a while.