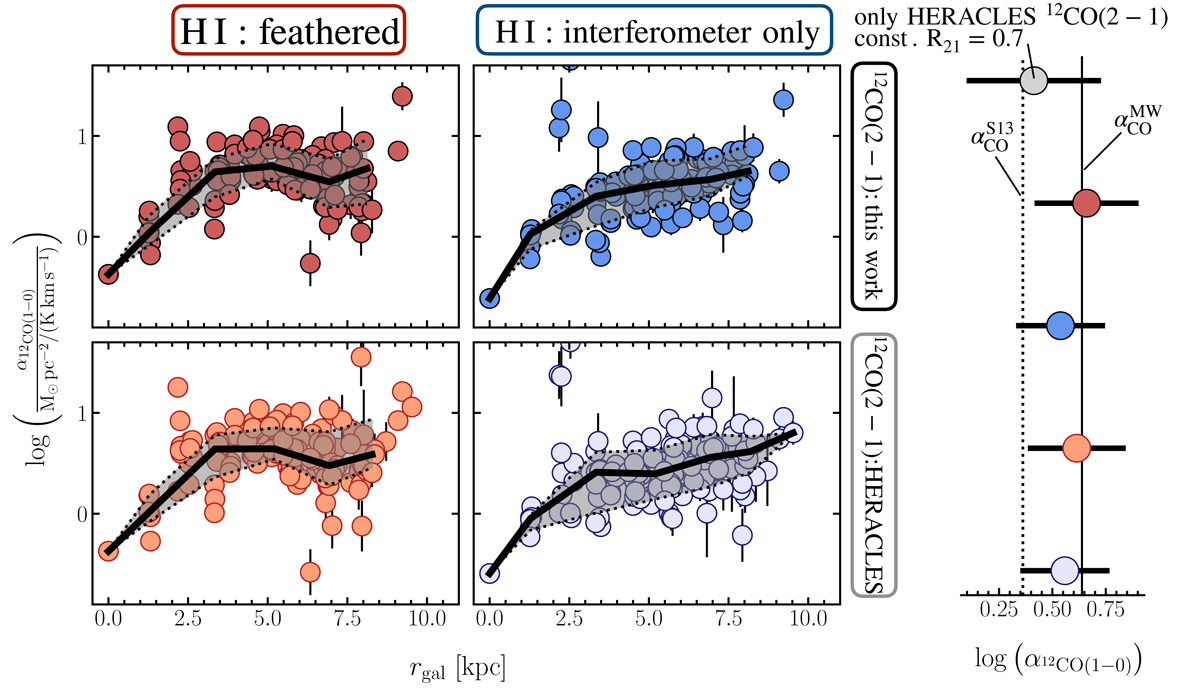
Fig. E.1.

Download original image
Comparing the Impact of Different Datasets on α12CO(1−0) Estimates. We compare the results after substituting feathered H I (left column) and non-feathered H I (right column) observations as well as different 12CO(2–1) observations (data from this project and HERACLES). The points show the resulting α12CO(1−0) value for the different solution pixels. The black line indicates the binned trend, and the shaded region illustrates the 1σ scatter per bin. The right panel shows the average values of the different permutations (color-coded). The grey point is based on using the 12CO(2–1) data only (and deriving the 12CO(1–0) data using a fixed R21). This approach reproduced the method by Sandstrom et al. (2013). The solid line indicates the average MW α12CO(1−0) value, and the dashed line shows the average value found by Sandstrom et al. (2013) for M101.
Current usage metrics show cumulative count of Article Views (full-text article views including HTML views, PDF and ePub downloads, according to the available data) and Abstracts Views on Vision4Press platform.
Data correspond to usage on the plateform after 2015. The current usage metrics is available 48-96 hours after online publication and is updated daily on week days.
Initial download of the metrics may take a while.


