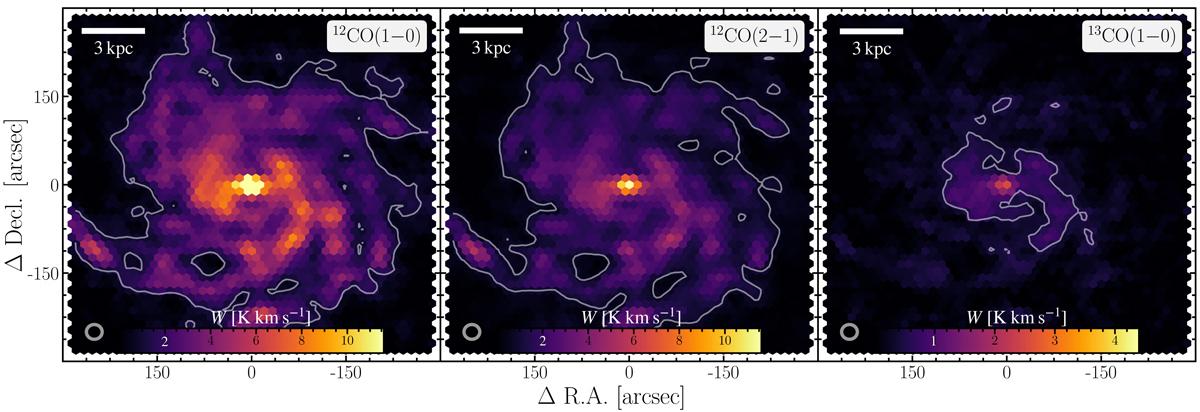
Fig. 2.
Download original image
Integrated intensities. All maps have been convolved to a common beamsize of 27″ (the beamsize is indicated by the circle in the lower left corner). Color scale in units K km s−1. Contour indicates S/N = 5 of the respective CO isotopologue transition. We do not provide the C18O(1–0) emission line map since we do not detect significant emission across the galaxy. Coordinates are relative to the center coordinates in Table 1.
Current usage metrics show cumulative count of Article Views (full-text article views including HTML views, PDF and ePub downloads, according to the available data) and Abstracts Views on Vision4Press platform.
Data correspond to usage on the plateform after 2015. The current usage metrics is available 48-96 hours after online publication and is updated daily on week days.
Initial download of the metrics may take a while.