Fig. C.2.
Download original image
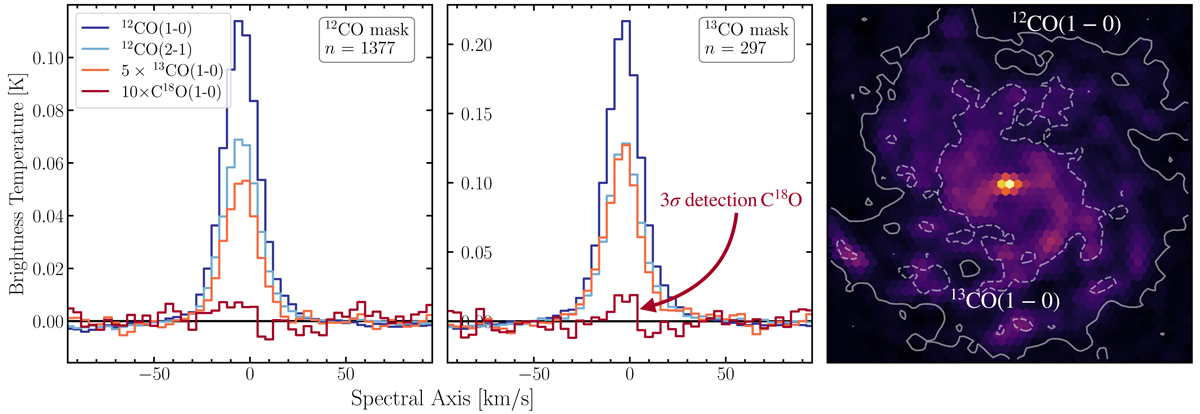
Stacked CO spectra over the full galaxy (Left) Stacked spectra over the 12CO(1–0) 3σ mask. 13CO(1–0) spectrum scaled up by a factor of 5, C18O(1–0) by a factor of 10. We mark the number of sightlines per mask with n. (Middle) Similar to the left panel, but stacked over the 13CO(1–0) 3σ mask. We do not detected significant C18O(1–0) emission. (Right) moment 0 map of 12CO(1–0). The S/N = 3 contour of 12CO(1–0) is illustrated by the solid line, while for 13CO(1–0) it is indicated by the dashed line.
Current usage metrics show cumulative count of Article Views (full-text article views including HTML views, PDF and ePub downloads, according to the available data) and Abstracts Views on Vision4Press platform.
Data correspond to usage on the plateform after 2015. The current usage metrics is available 48-96 hours after online publication and is updated daily on week days.
Initial download of the metrics may take a while.