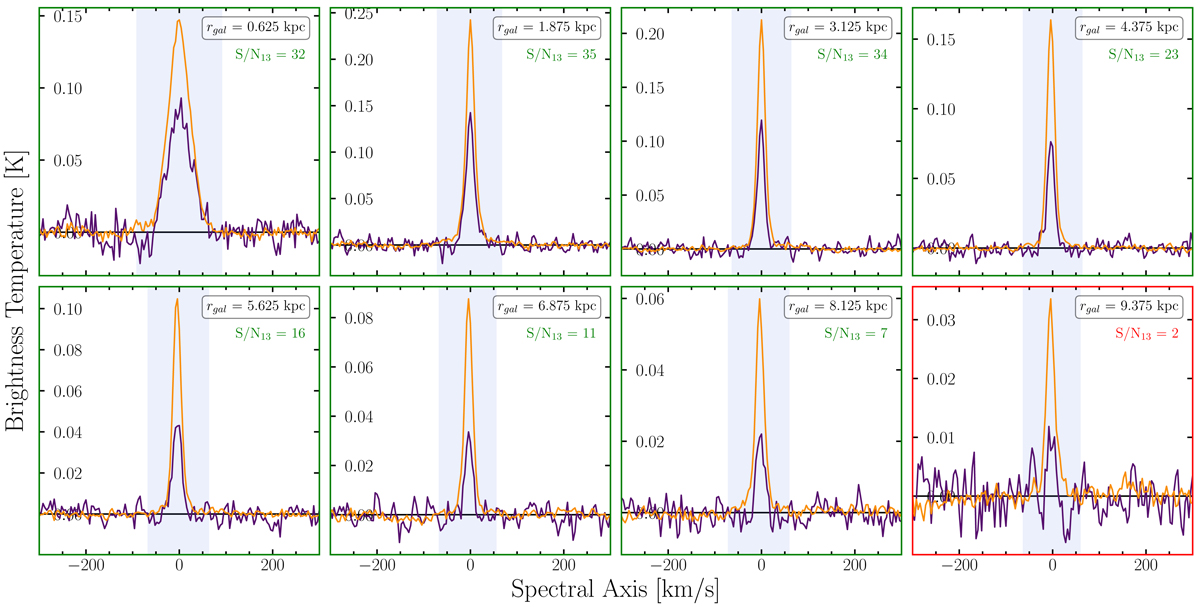
Fig. C.1.
Download original image
Radially stacked 12CO(1–0) (orange) and 13CO(1–0) (purple) spectra. For a better comparison, we scale the 13CO(1–0) brightness temperature up by a factor 5. The S/N of the 13CO(1–0) is indicated in each panel (green indicates spectra where S/N13 > 5. We stack in radial bins of size 1.25 kpc. The shaded region indicates the spectral range over which we integrate the spectra. We detect significant 13CO(1–0) emission out to rgal ∼ 8 kpc.
Current usage metrics show cumulative count of Article Views (full-text article views including HTML views, PDF and ePub downloads, according to the available data) and Abstracts Views on Vision4Press platform.
Data correspond to usage on the plateform after 2015. The current usage metrics is available 48-96 hours after online publication and is updated daily on week days.
Initial download of the metrics may take a while.