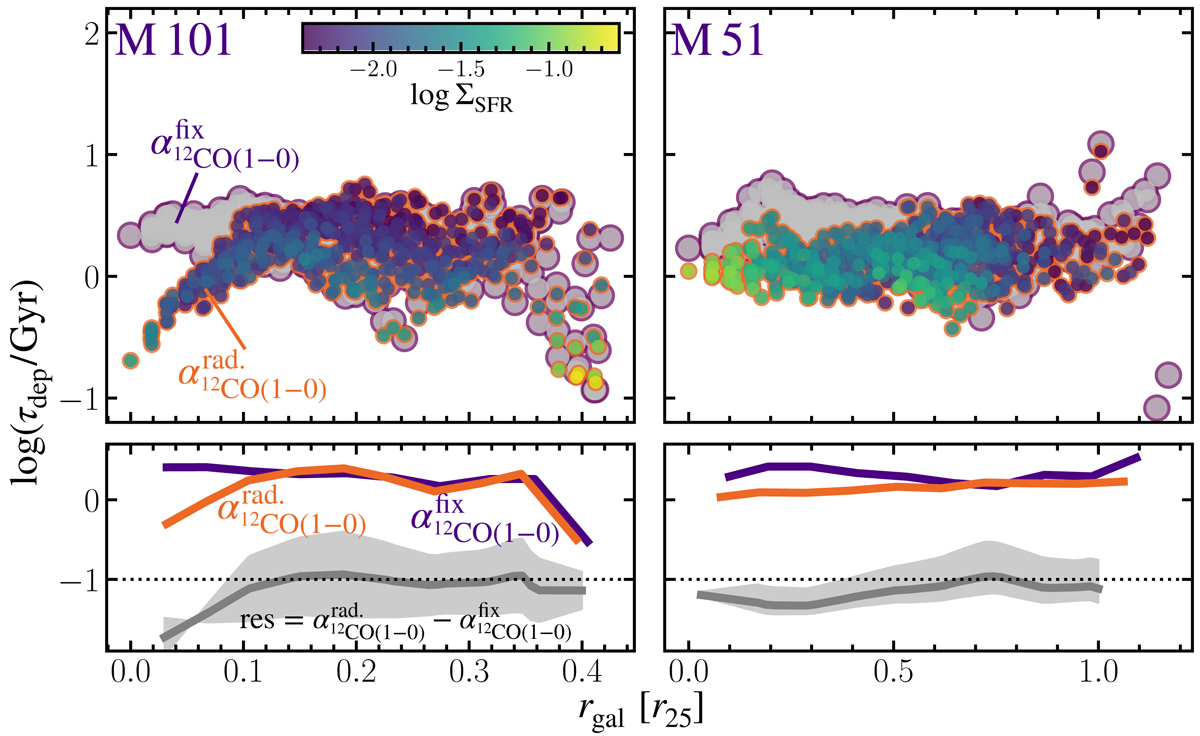
Fig. 14.
Download original image
Impact of varying R21 and α12CO(1−0) on the molecular gas depletion time The top panels show the radial trend of the depletion time for M101 (left), M51 (center), and for the combination of the sightlines from both galaxies (right). The depletion time depends on a measurement of the molecular gas mass. The grey points (with purple edge color) show the measurements using CO(2–1) and fixed R21 and α12CO(1−0) values. The points color-coded by SFR surface density are from using CO(1–0) and a radially interpolated α12CO(1−0). The bottom panels compare the radially binned trends of both measurements. The grey line indicates the residual between the two trend lines.
Current usage metrics show cumulative count of Article Views (full-text article views including HTML views, PDF and ePub downloads, according to the available data) and Abstracts Views on Vision4Press platform.
Data correspond to usage on the plateform after 2015. The current usage metrics is available 48-96 hours after online publication and is updated daily on week days.
Initial download of the metrics may take a while.