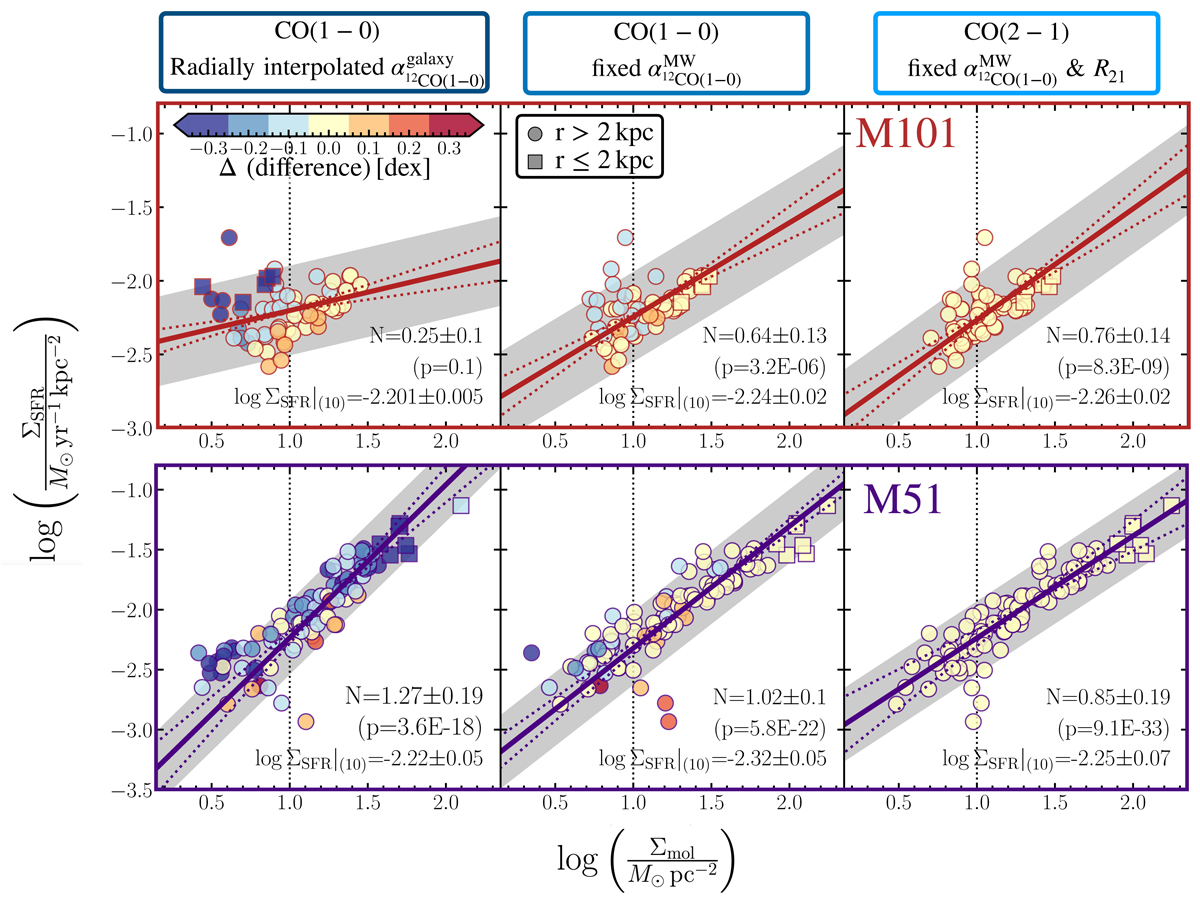
Fig. 13.
Download original image
Impact of varying R21 and α12CO(1−0) on the Kennicutt-Schmidt relation We compare the KS relation using three different ways of estimating the molecular gas mass, Σmol: (i) 12CO(1–0) and a radially interpolated α12CO(1−0) derived for each galaxy (ii) 12CO(1–0) and a fixed α12CO(1 − 0)MW = 4.3 M⊙ pc−2/(K km s−1), and (iii) 12CO(2–1) and a fixed R21 = 0.6 (and R21 = 0.9 in M51; den Brok et al. 2022). The resulting KS index, N, is determined using an orthogonal distance regression (fit indicated by solid line) and indicated in each panel with its 1σ uncertainty. In addition, each panel also lists the ΣSFR value (in log) at Σmol = 10 M⊙ pc−2, as derived from the linear fit. The KS coefficient, N, the Pearson’s correlation coefficient, p, and as the SFR surface density at a molecular gas mass surface density of 10 M⊙ pc−2 or the linear relationship are indicated in each panel as well. The grey shaded region shows the ±0.30 dex dispersion which is expected for a larger sample of galaxies (Bigiel et al. 2008; Leroy et al. 2013). The points, which represent the individual solution pixels, are color-coded by their difference (in dex) in Σmol to the molecular gas mass determined using method (iii), which is shown in the right panel. Squares indicate the central points (r ≤ 2 kpc).
Current usage metrics show cumulative count of Article Views (full-text article views including HTML views, PDF and ePub downloads, according to the available data) and Abstracts Views on Vision4Press platform.
Data correspond to usage on the plateform after 2015. The current usage metrics is available 48-96 hours after online publication and is updated daily on week days.
Initial download of the metrics may take a while.