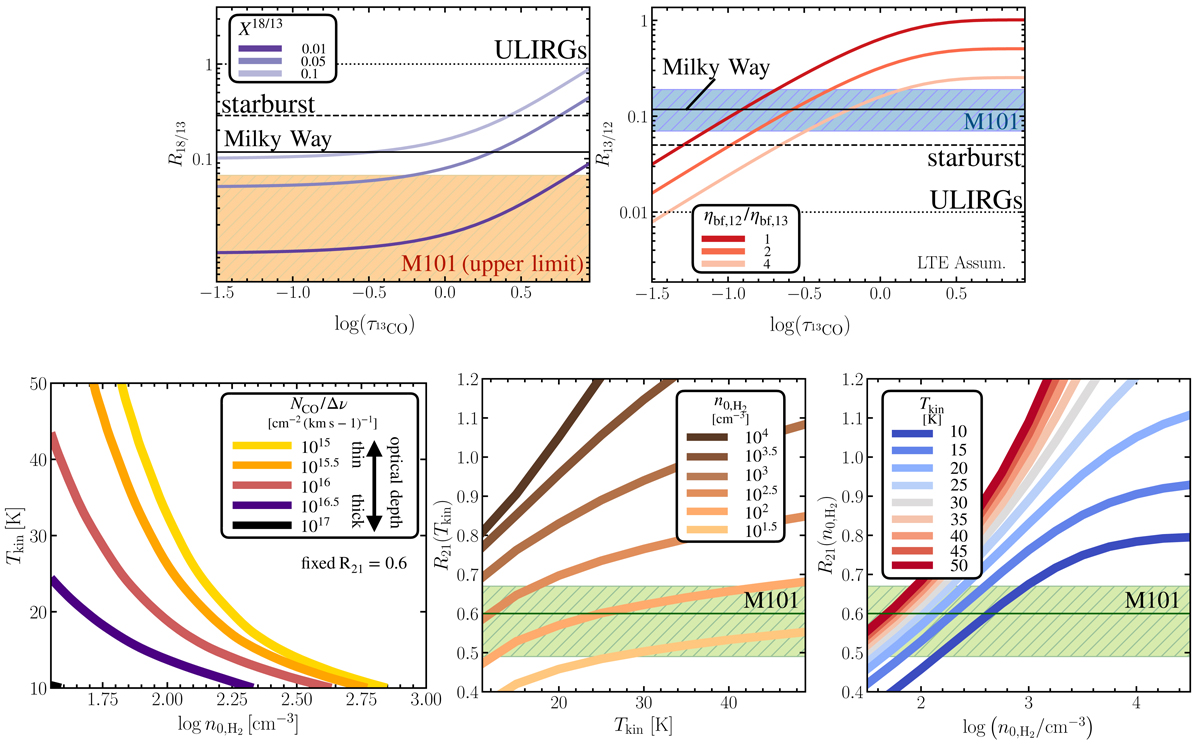
Fig. 12.
Download original image
Effect of 13CO optical depth on CO line ratios under LTE (top) and non-LTE (bottom) conditions. We assume optically thick 12CO and optically thin C18O emission. Top left: variation of R18/13 with τ13CO for different abundance ratios of the 13CO and C18O species. We do not significantly detect C18O in the center of the galaxy. The orange shaded region hence shows the region where the line ratio in M101’s central 4 kpc region could fall. Average MW value (solid line; Wouterloot et al. 2008), starburst (dashed line; e.g., Tan et al. 2011), and ULIRGs (dotted; e.g., Greve et al. 2009) is shown. Top right: variation of R13/12 with τ13CO for different beam filling factor ratios between the 12CO and 13CO emission, η12 and η13. The blue band shows the range of measured R13/12 values in M101. Average MW value from Roman-Duval et al. (2016), starburst and ULIRGs from Sliwa & Downes 2017. Bottom panels: we use the line ratio model calculation provided in Leroy et al. (2022). These are based on model calculations with RADEX (van der Tak et al. 2007) and used a lognormal density distributions described in Leroy et al. (2017b). Bottom left: we fix the ratio at R21 = 0.6 and use a lognormal density distribution width of σ = 0.6. The color-coded lines show as a function of H2 volume density (x-axis) and kinetic temperature Tkin (y-axis) the trends for different total CO column densities per line width (NCO/Δν), which roughly correlate with the optical depth. Bottom center: the line ratio R21 as a function of kinetic temperature for different mean molecular gas densities. Bottom right: the line ratio R21 as a function of the mean molecular gas density for different kinetic temperatures. The green shaded region shows the 16th to 84th percentile range for the values found in M101. For the computation of R21 as function of temperature and density, we fix σ = 0.6 dex and NCO/Δv = 1016 cm−2 (km s−1)−1. We note that we assume a common excitation (density, temperature) for all species and LTE for the top panels.
Current usage metrics show cumulative count of Article Views (full-text article views including HTML views, PDF and ePub downloads, according to the available data) and Abstracts Views on Vision4Press platform.
Data correspond to usage on the plateform after 2015. The current usage metrics is available 48-96 hours after online publication and is updated daily on week days.
Initial download of the metrics may take a while.