Fig. 11.
Download original image
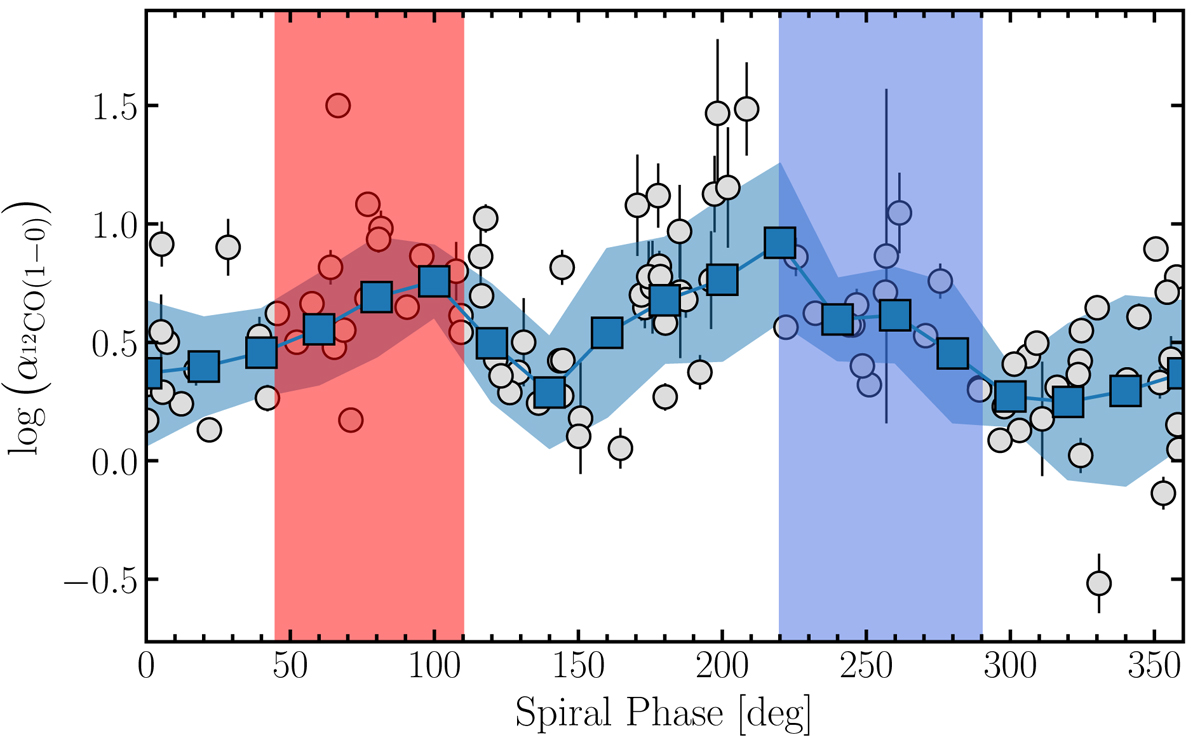
Arm-interarm variation of α12CO(1−0)in M51. The graph shows the 12CO(1–0) intensity binned by spiral phase. The blue points show the stacked line ratio by spiral phases in steps of 20°, increasing counter-clockwise. The vertical red and blue shaded regions show the extent of spiral phases that correspond to the northern (red) and southern (blue) spiral arm of the galaxy.
Current usage metrics show cumulative count of Article Views (full-text article views including HTML views, PDF and ePub downloads, according to the available data) and Abstracts Views on Vision4Press platform.
Data correspond to usage on the plateform after 2015. The current usage metrics is available 48-96 hours after online publication and is updated daily on week days.
Initial download of the metrics may take a while.