Fig. 1.
Download original image
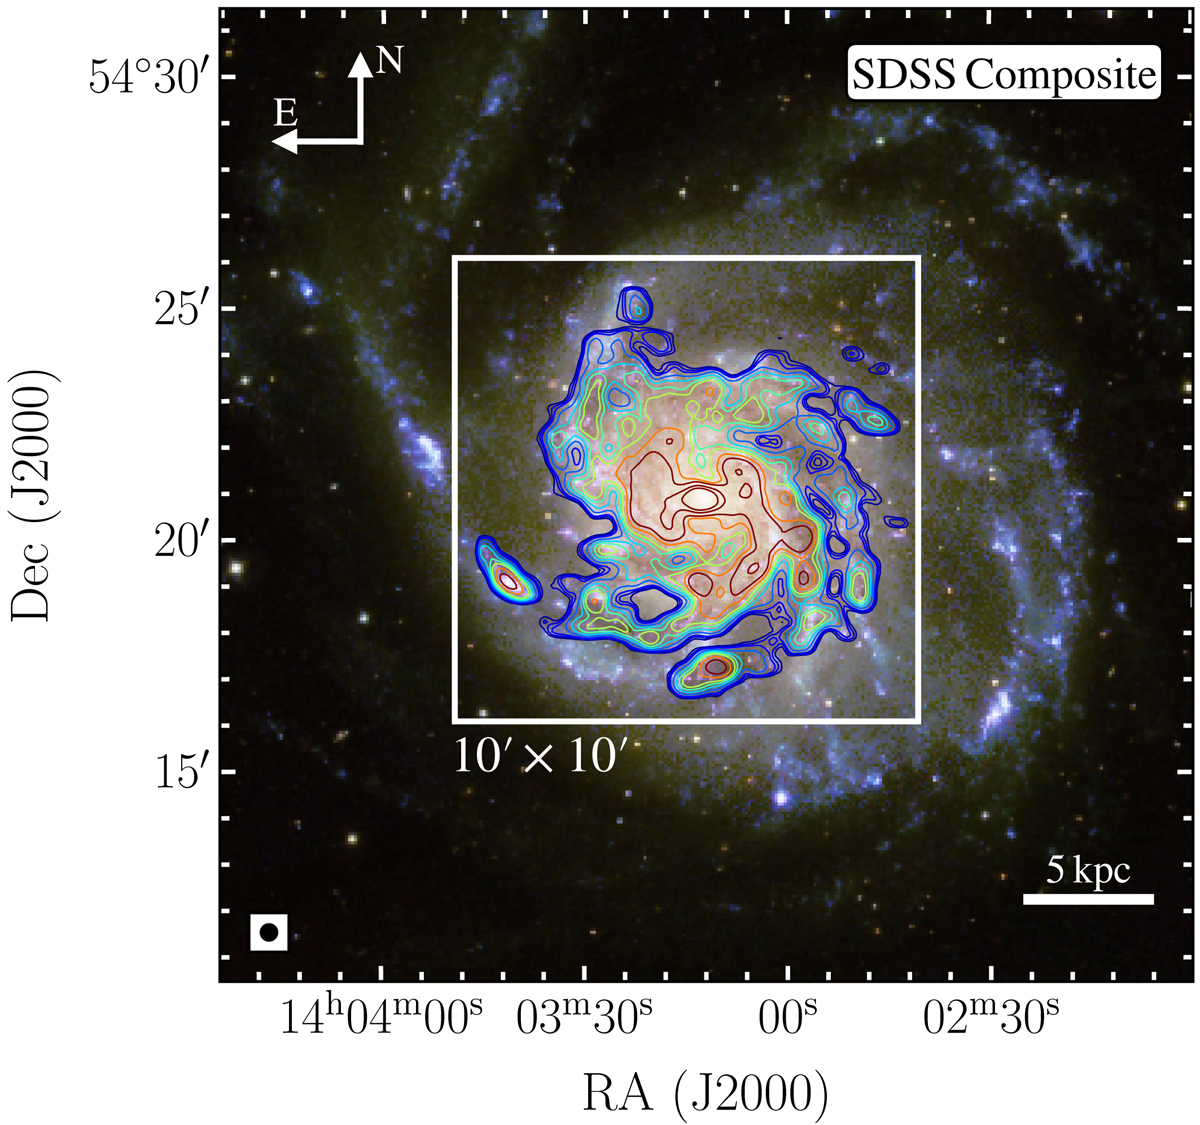
SDSS composite RGB image with 12CO(1–0) overlay. Color image using public SDSS data from the 16th data release (Ahumada et al. 2020). We combined the u, g, and r filter bands. Contours illustrate the IRAM 30 m 12CO(1–0) integrated intensities. The mm observations have a resolution of 23″(∼800 pc), and are indicated by the black circle in the lower left. The 10′×10′ field-of-view of our IRAM 30 m observation is indicated by the white rectangular outline. Contours are drawn at arbitrary intervals between 0.5 − 10 K km s−1 to highlight the structure of the galaxy.
Current usage metrics show cumulative count of Article Views (full-text article views including HTML views, PDF and ePub downloads, according to the available data) and Abstracts Views on Vision4Press platform.
Data correspond to usage on the plateform after 2015. The current usage metrics is available 48-96 hours after online publication and is updated daily on week days.
Initial download of the metrics may take a while.