Fig. 5
Download original image
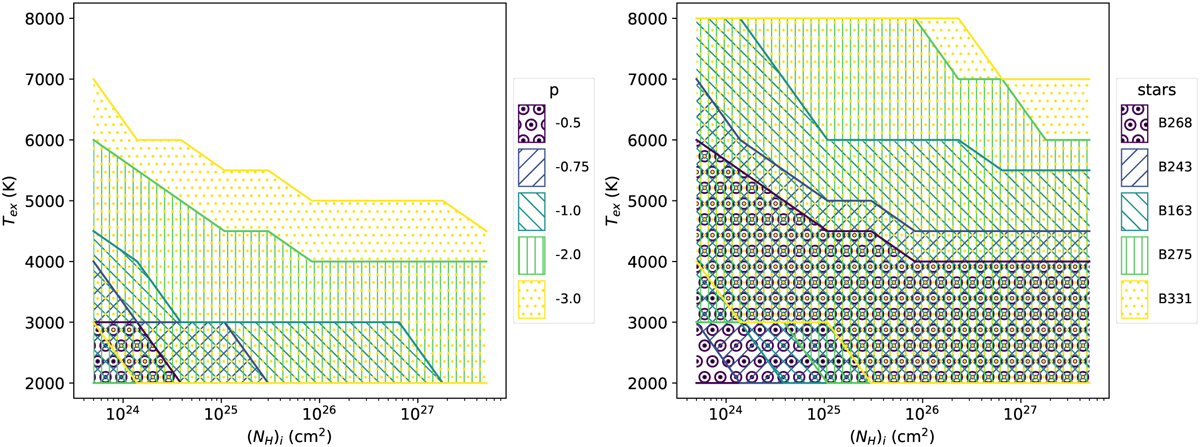
Illustration of the temperature and column density ranges that, for fixed parameters Ri ≈ 0.25 AU, q = −1.5, i = 40°, and υG = 1 km s−1, lead to CO first overtone bandhead maximum flux values between 2 and 25% continuum, which represent the minimum detectable and the maximum observed normalized fluxes respectively. Left: the accessible parameter space for different values of the temperature exponent p (models are for B268). Right: the same, for the different stars as varying in mass and continuum emission (models are for p = −2).
Current usage metrics show cumulative count of Article Views (full-text article views including HTML views, PDF and ePub downloads, according to the available data) and Abstracts Views on Vision4Press platform.
Data correspond to usage on the plateform after 2015. The current usage metrics is available 48-96 hours after online publication and is updated daily on week days.
Initial download of the metrics may take a while.