Fig. 8
Download original image
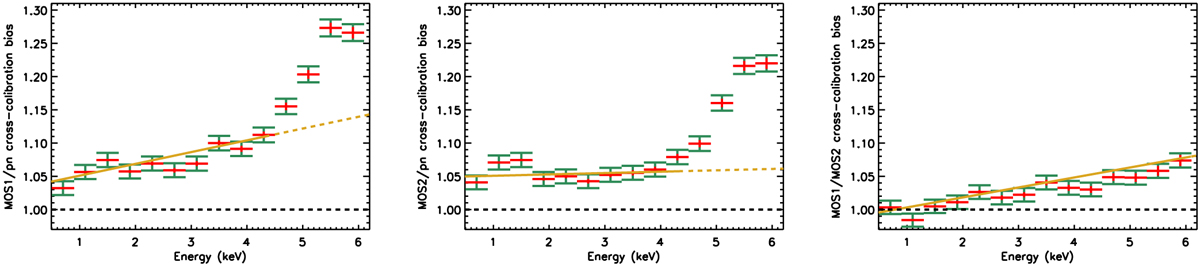
Median of the measures of cross-calibration bias, with statistical and systematic uncertainties (red and green symbols, repeated from the bottom panel of Fig. 5) for the MOS1/pn (left panel), MOS2/pn pair (middle panel), and MOS1/MOS2 pairs. The solid golden lines in the left and middle panels indicate the linear models whose parameters are the medians of those obtained by fitting the individual cluster data for MOS/pn pairs in the 0.5–4.5 keV band with a linear model. The dashed golden lines indicate the extrapolation of the above models to the 4.5–6.1 keV band. The MOS1/MOS2 data were fitted in the 0.5–6.1 keV band (right panel). In all panels, the horizontal dashed line indicates the expectation (unity) in the case of no cross-calibration bias.
Current usage metrics show cumulative count of Article Views (full-text article views including HTML views, PDF and ePub downloads, according to the available data) and Abstracts Views on Vision4Press platform.
Data correspond to usage on the plateform after 2015. The current usage metrics is available 48-96 hours after online publication and is updated daily on week days.
Initial download of the metrics may take a while.