Fig. 7
Download original image
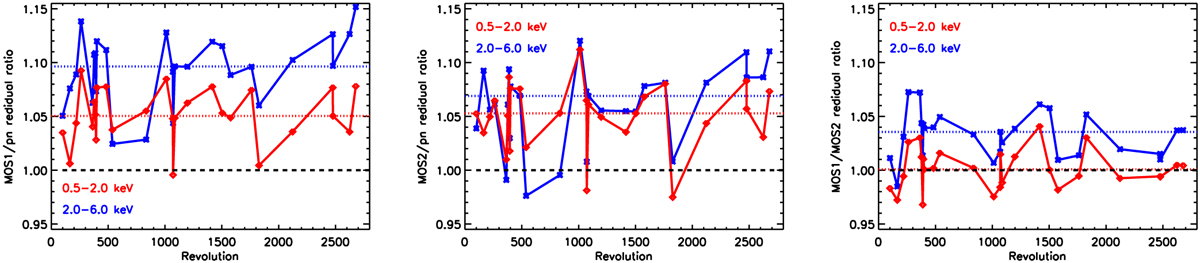
Cross-calibration bias factor J1 using Method 1 (Eq. (3)) in the 0.5−2.0 keV band (red lines and symbols) and the 2.0−6.0 keV band (blue lines and symbols) as a function of the time (revolution number during which the given observation was performed) for MOS1/pn (left panel), MOS2/pn (middle panel), or MOS1/MOS2 (right panel) pairs. The dotted lines indicate the sample median.
Current usage metrics show cumulative count of Article Views (full-text article views including HTML views, PDF and ePub downloads, according to the available data) and Abstracts Views on Vision4Press platform.
Data correspond to usage on the plateform after 2015. The current usage metrics is available 48-96 hours after online publication and is updated daily on week days.
Initial download of the metrics may take a while.