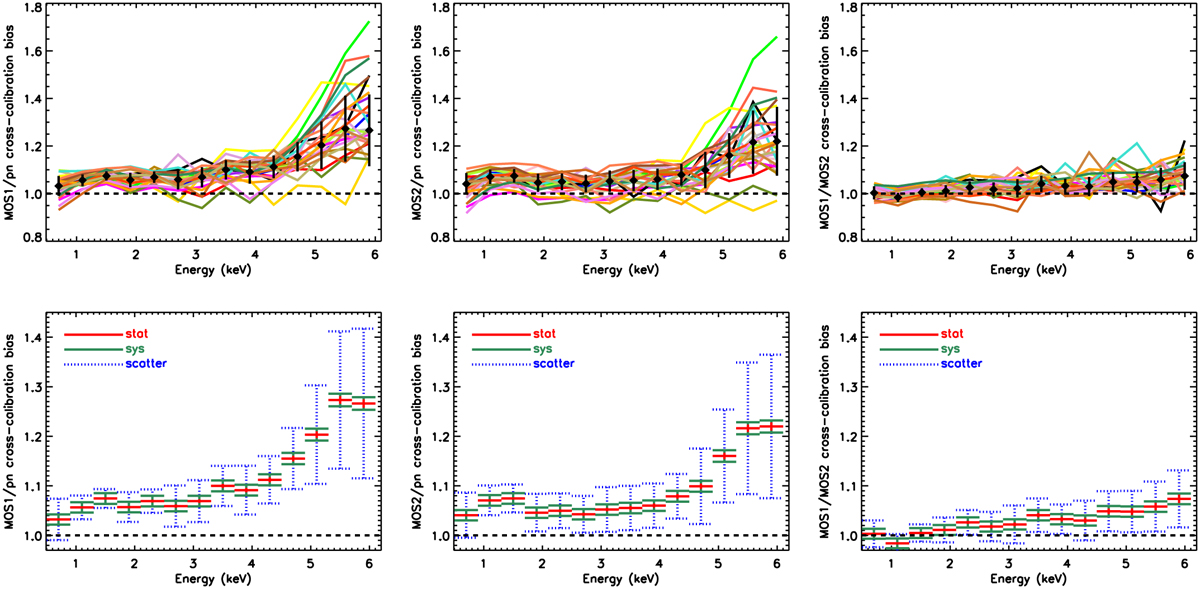
Fig. 5
Download original image
Results obtained by analysing the measure of the cross-calibration bias (J2; see Eq. (6)). Upper panels: J2 for each observation for MOS1/pn (left panel) and MOS2/pn (middle panel) obtained via Method 2 (see the main text). Each line connects the values of one cluster at the energy bin centres. The black symbols and vertical lines indicate the median and the standard deviation of the sample at each energy. Lower panels: median J2 of the sample and their statistical (red crosses) and systematic (green crosses) uncertainties for MOS1/pn (left panel) and MOS2/pn (middle panel) pairs. The blue crosses indicate the standard deviation of the sample at a given energy (they are equal to the horizontal black lines in the upper panels). In all panels, the horizontal dashed line indicates the expectation (unity) in the case of no cross-calibration bias. Please note that the scales of the vertical axes are different in the upper and lower panels in order to better highlight the details. Right panels: approximative results for MOS1/MOS2 pair obtained by dividing the results of the left and middle panels.
Current usage metrics show cumulative count of Article Views (full-text article views including HTML views, PDF and ePub downloads, according to the available data) and Abstracts Views on Vision4Press platform.
Data correspond to usage on the plateform after 2015. The current usage metrics is available 48-96 hours after online publication and is updated daily on week days.
Initial download of the metrics may take a while.