Fig. 4
Download original image
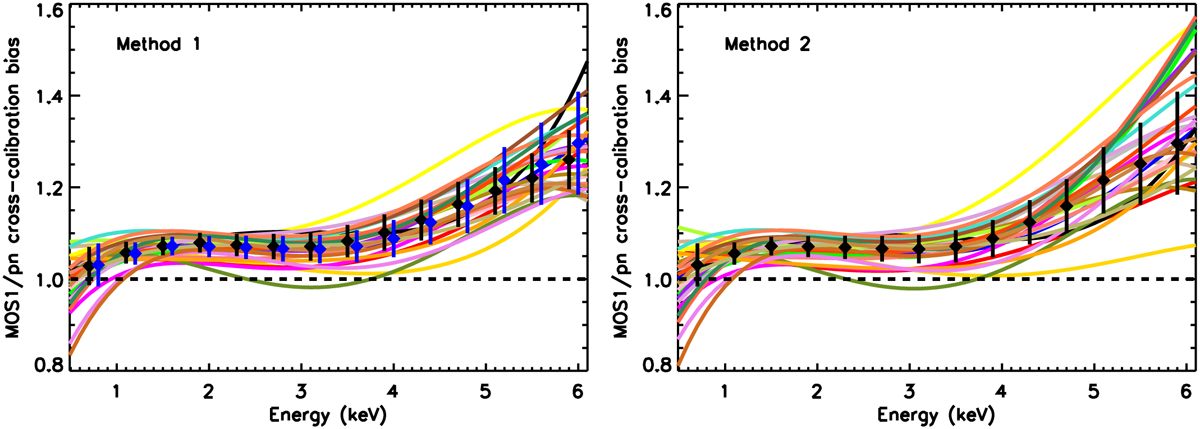
Best-fit models for each individual cluster obtained by fitting the MOS1/pn cross-calibration data using Eq. (4) when applying Method 1 (left panel) or Method 2 (right panel). Each solid line connects the values of one cluster at the energy bin centres. The black symbols and vertical lines indicate the median and the standard deviation of the sample at each energy. The symbols from the right panel are repeated in the left panel in blue. The horizontal dashed line at unity indicates the expectation in the case of no cross-calibration bias.
Current usage metrics show cumulative count of Article Views (full-text article views including HTML views, PDF and ePub downloads, according to the available data) and Abstracts Views on Vision4Press platform.
Data correspond to usage on the plateform after 2015. The current usage metrics is available 48-96 hours after online publication and is updated daily on week days.
Initial download of the metrics may take a while.