Fig. 3
Download original image
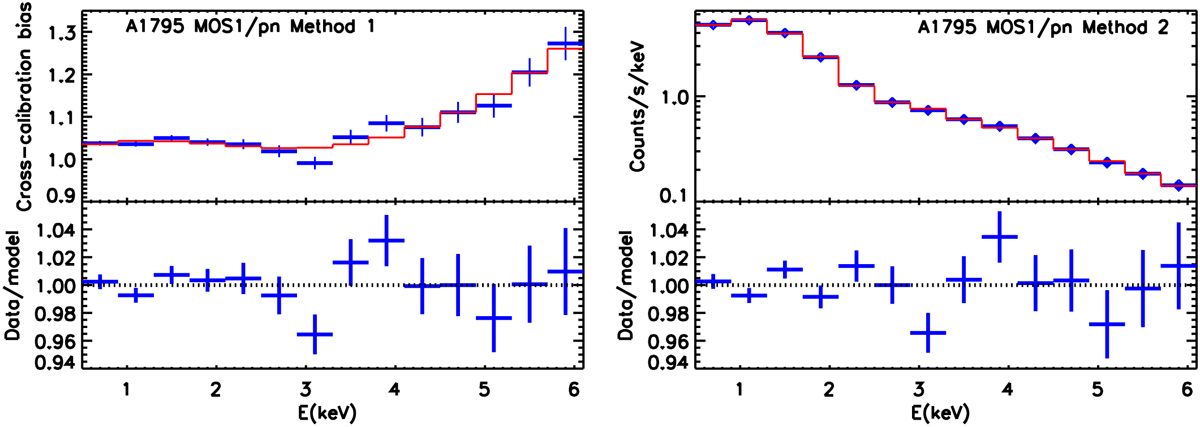
Demonstration of the quality of the modelling of the MOS1/pn cross-calibration bias for A1795 using Method 1 (left panel) and Method 2 (right panel). When applying Method 1, we evaluate Eq. (3), i.e. we approximate the cross-calibration bias after the convolution (blue crosses in the upper-left panel). The best-fit model (Eq. (4)) to such data is shown as a red line. When applying Method 2, we fit the MOS1 spectra (blue symbols in the upper-right panel; the statistical uncertainty is smaller than the plot symbol) with a model consisting of a fixed component for accurate modelling of the pn data (see the main text for details), while the cross-calibration bias is modelled as a fourth-order polynomial (the total model is shown as a red line in the upper-right panel; see Eq. (5)). In both cases, the lower panel shows the ratio of the best-fit model to the data.
Current usage metrics show cumulative count of Article Views (full-text article views including HTML views, PDF and ePub downloads, according to the available data) and Abstracts Views on Vision4Press platform.
Data correspond to usage on the plateform after 2015. The current usage metrics is available 48-96 hours after online publication and is updated daily on week days.
Initial download of the metrics may take a while.