Fig. 2
Download original image
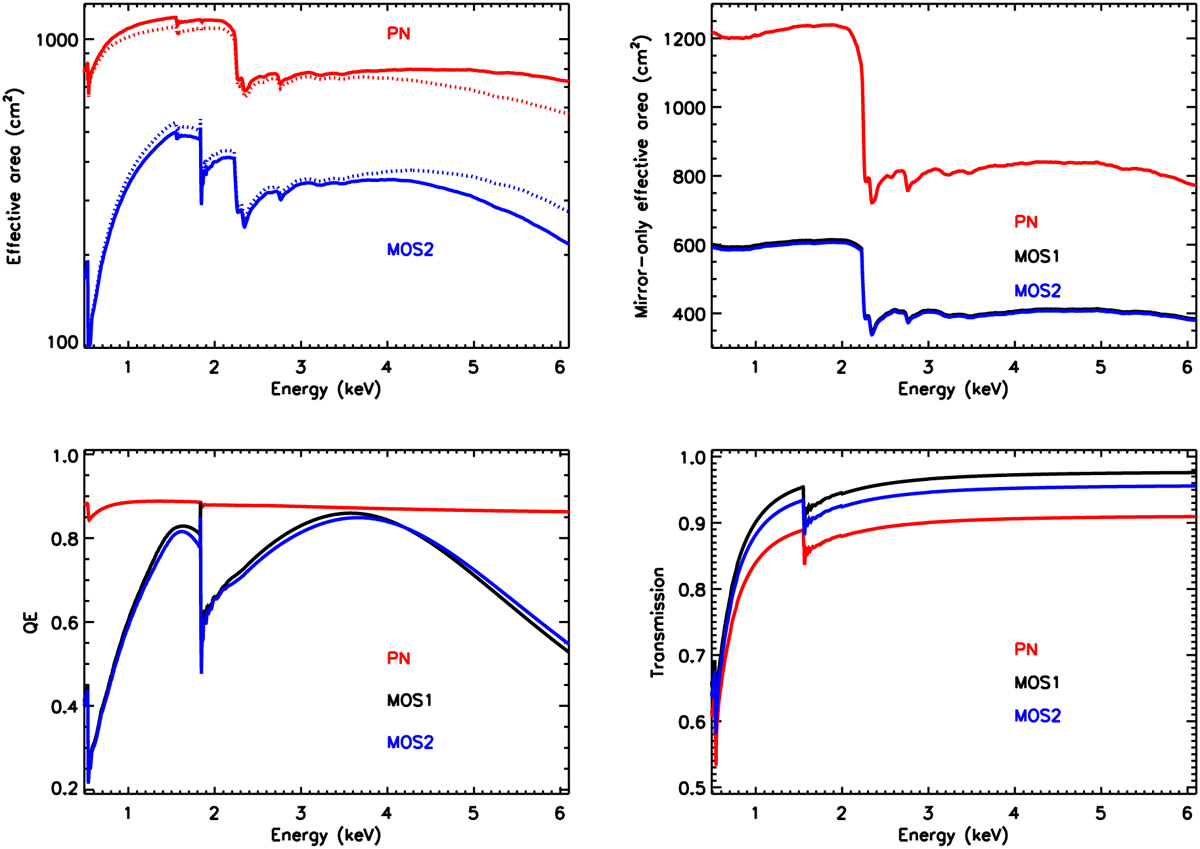
Different components of instrumentation for A1795 observation 0723802101 for pn (red lines), MOS1 (black lines), and MOS2 (blue lines). The top-left panel shows the total effective area generated with arfgen (solid lines; for clarity, MOS1 is not shown). The dotted lines indicate the average correction to the effective area assuming that the other instrument is perfectly calibrated (see Sect. 6). The other panels show the mirror-only effective area (top right), the QE of the detector (bottom left), and the transmission of the optical filter (bottom right).
Current usage metrics show cumulative count of Article Views (full-text article views including HTML views, PDF and ePub downloads, according to the available data) and Abstracts Views on Vision4Press platform.
Data correspond to usage on the plateform after 2015. The current usage metrics is available 48-96 hours after online publication and is updated daily on week days.
Initial download of the metrics may take a while.