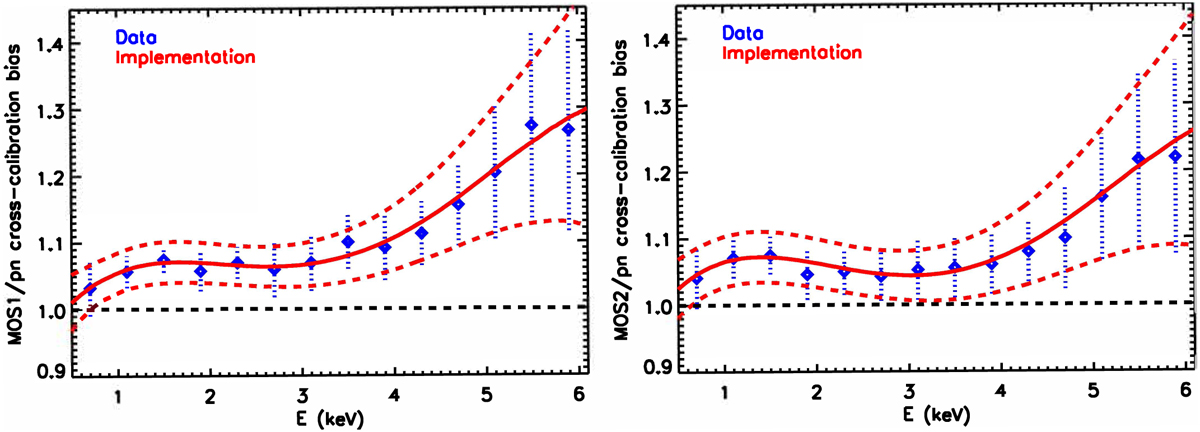
Fig. B.1
Download original image
Median (solid red line) and the variation as measured by the standard deviation (dashed red lines) of the cross-calibration bias parameter, J2, of the sample obtained by the procedure laid out in Appendix B. The blue symbols indicate the corresponding values obtained from the cluster data (repeated from Fig. 5). The results for the MOS1/pn and MOS2/pn pairs are shown in the left and right panels, respectively. The horizontal dashed line indicates the expectation (unity) in the case of no cross-calibration bias.
Current usage metrics show cumulative count of Article Views (full-text article views including HTML views, PDF and ePub downloads, according to the available data) and Abstracts Views on Vision4Press platform.
Data correspond to usage on the plateform after 2015. The current usage metrics is available 48-96 hours after online publication and is updated daily on week days.
Initial download of the metrics may take a while.