Fig. 10
Download original image
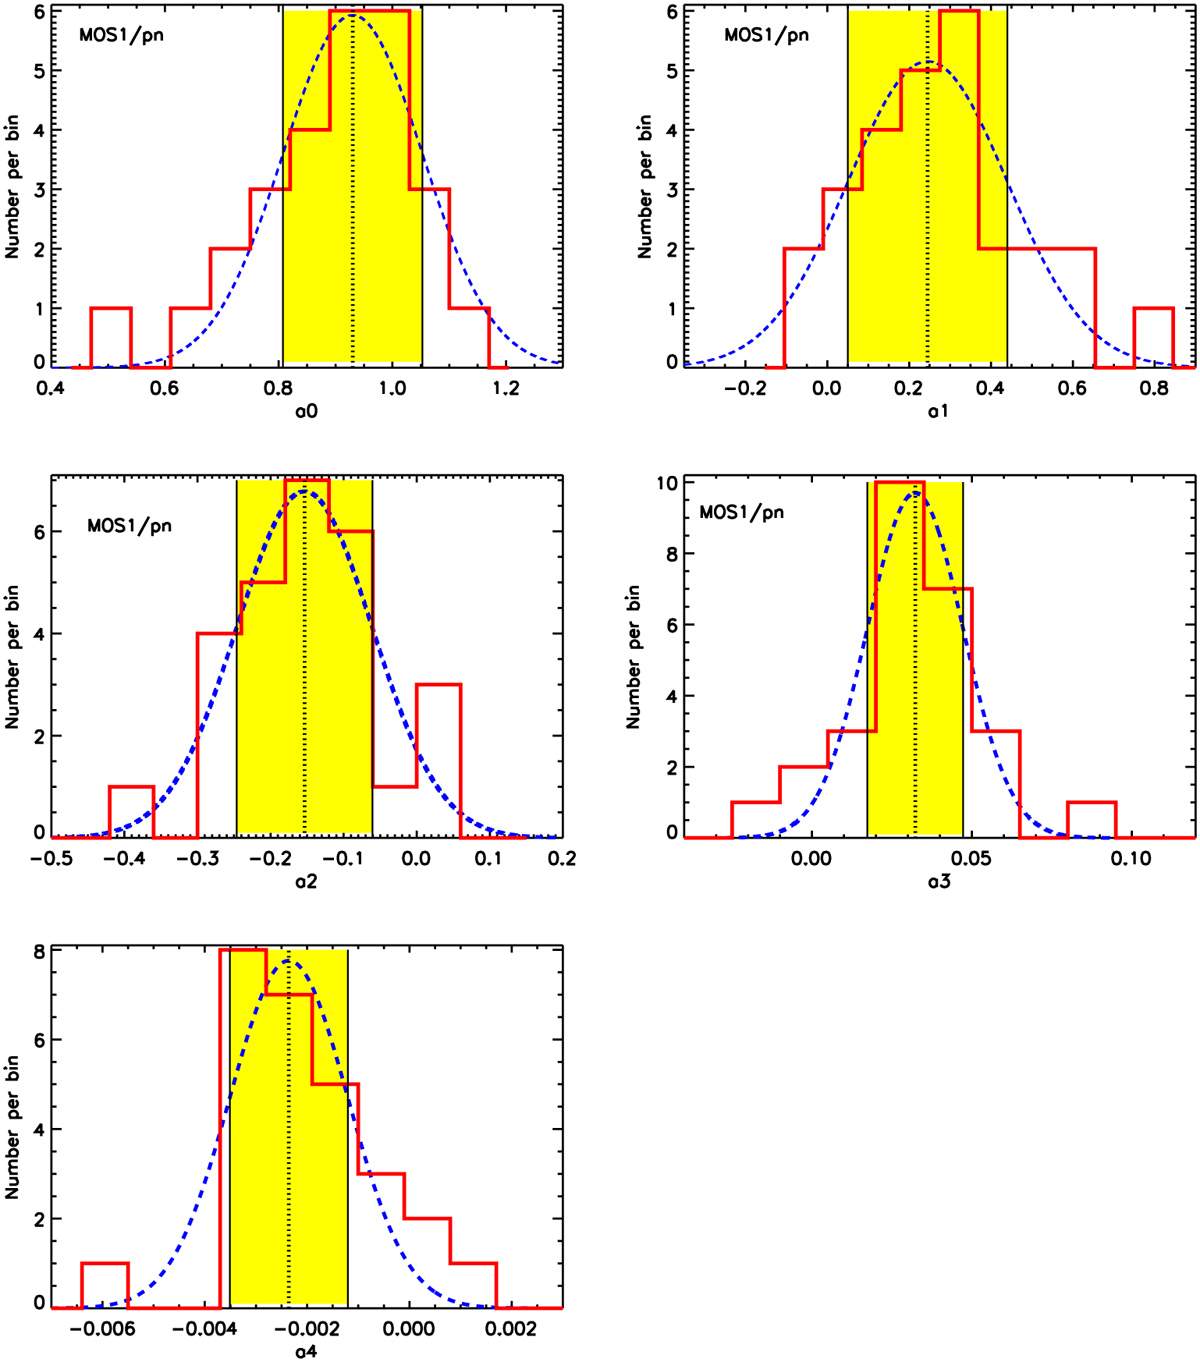
Distributions of the best-fit parameters of the fourth-order polynomials used for modelling the cross-calibration bias of single clusters for the MOS1/pn pair shown with the red histogram. The best-fit Gaussians to the above distributions are shown as a dashed blue line. The best-fit centroid of the Gaussian and the central interval containing 68% of the probability interval are indicated with a dashed black line and the yellow band, respectively.
Current usage metrics show cumulative count of Article Views (full-text article views including HTML views, PDF and ePub downloads, according to the available data) and Abstracts Views on Vision4Press platform.
Data correspond to usage on the plateform after 2015. The current usage metrics is available 48-96 hours after online publication and is updated daily on week days.
Initial download of the metrics may take a while.