Fig. 9.
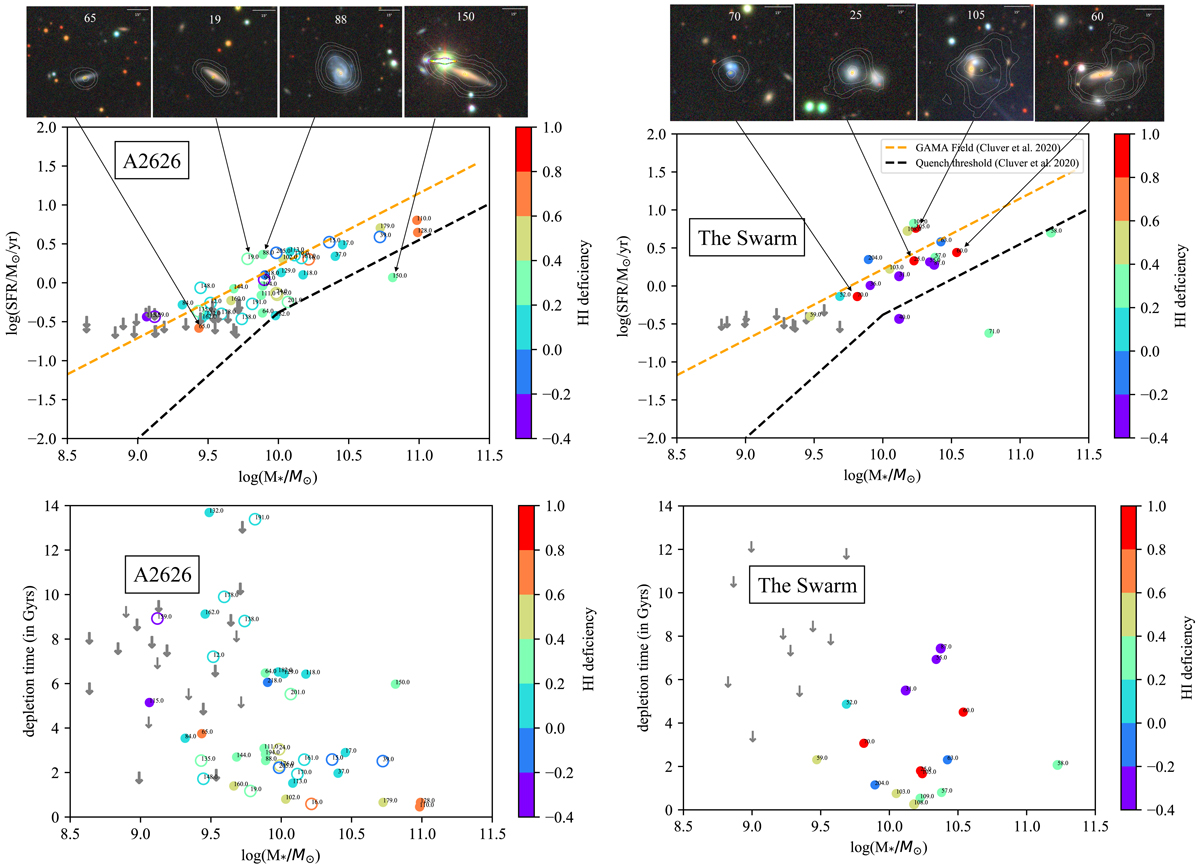
Download original image
Star formation rates and gas depletion times as a function of stellar mass and H I deficiency for galaxies in A2626 and the Swarm. Top left panel: SFMS for the non-substructure (filled circles) and substructure (open circles) galaxies in A2626. The SFMS relation and quenching threshold are taken from Cluver et al. (2020), which were calibrated using the WISE data and with the same methods as were used for the stellar mass and SFR calculations for the galaxies in our survey. The colour scale (shown on the right) represents the H I deficiency for the galaxies. The downward arrows are 2σ upper limits on the SFR from WISE observations. In the top panels, we show H I maps overlaid on DECaLS colour images for some outlier galaxies. Top right panel: similar to the plot on the top left, but for galaxies in the Swarm. Bottom left panel: H I depletion time vs. stellar mass of the non-substructure (filled circles) and substructure (open circles) galaxies in A2626. The colour scale presents the H I deficiency of the galaxies. Bottom right panel: similar to the bottom left plot, but for the galaxies in the Swarm.
Current usage metrics show cumulative count of Article Views (full-text article views including HTML views, PDF and ePub downloads, according to the available data) and Abstracts Views on Vision4Press platform.
Data correspond to usage on the plateform after 2015. The current usage metrics is available 48-96 hours after online publication and is updated daily on week days.
Initial download of the metrics may take a while.