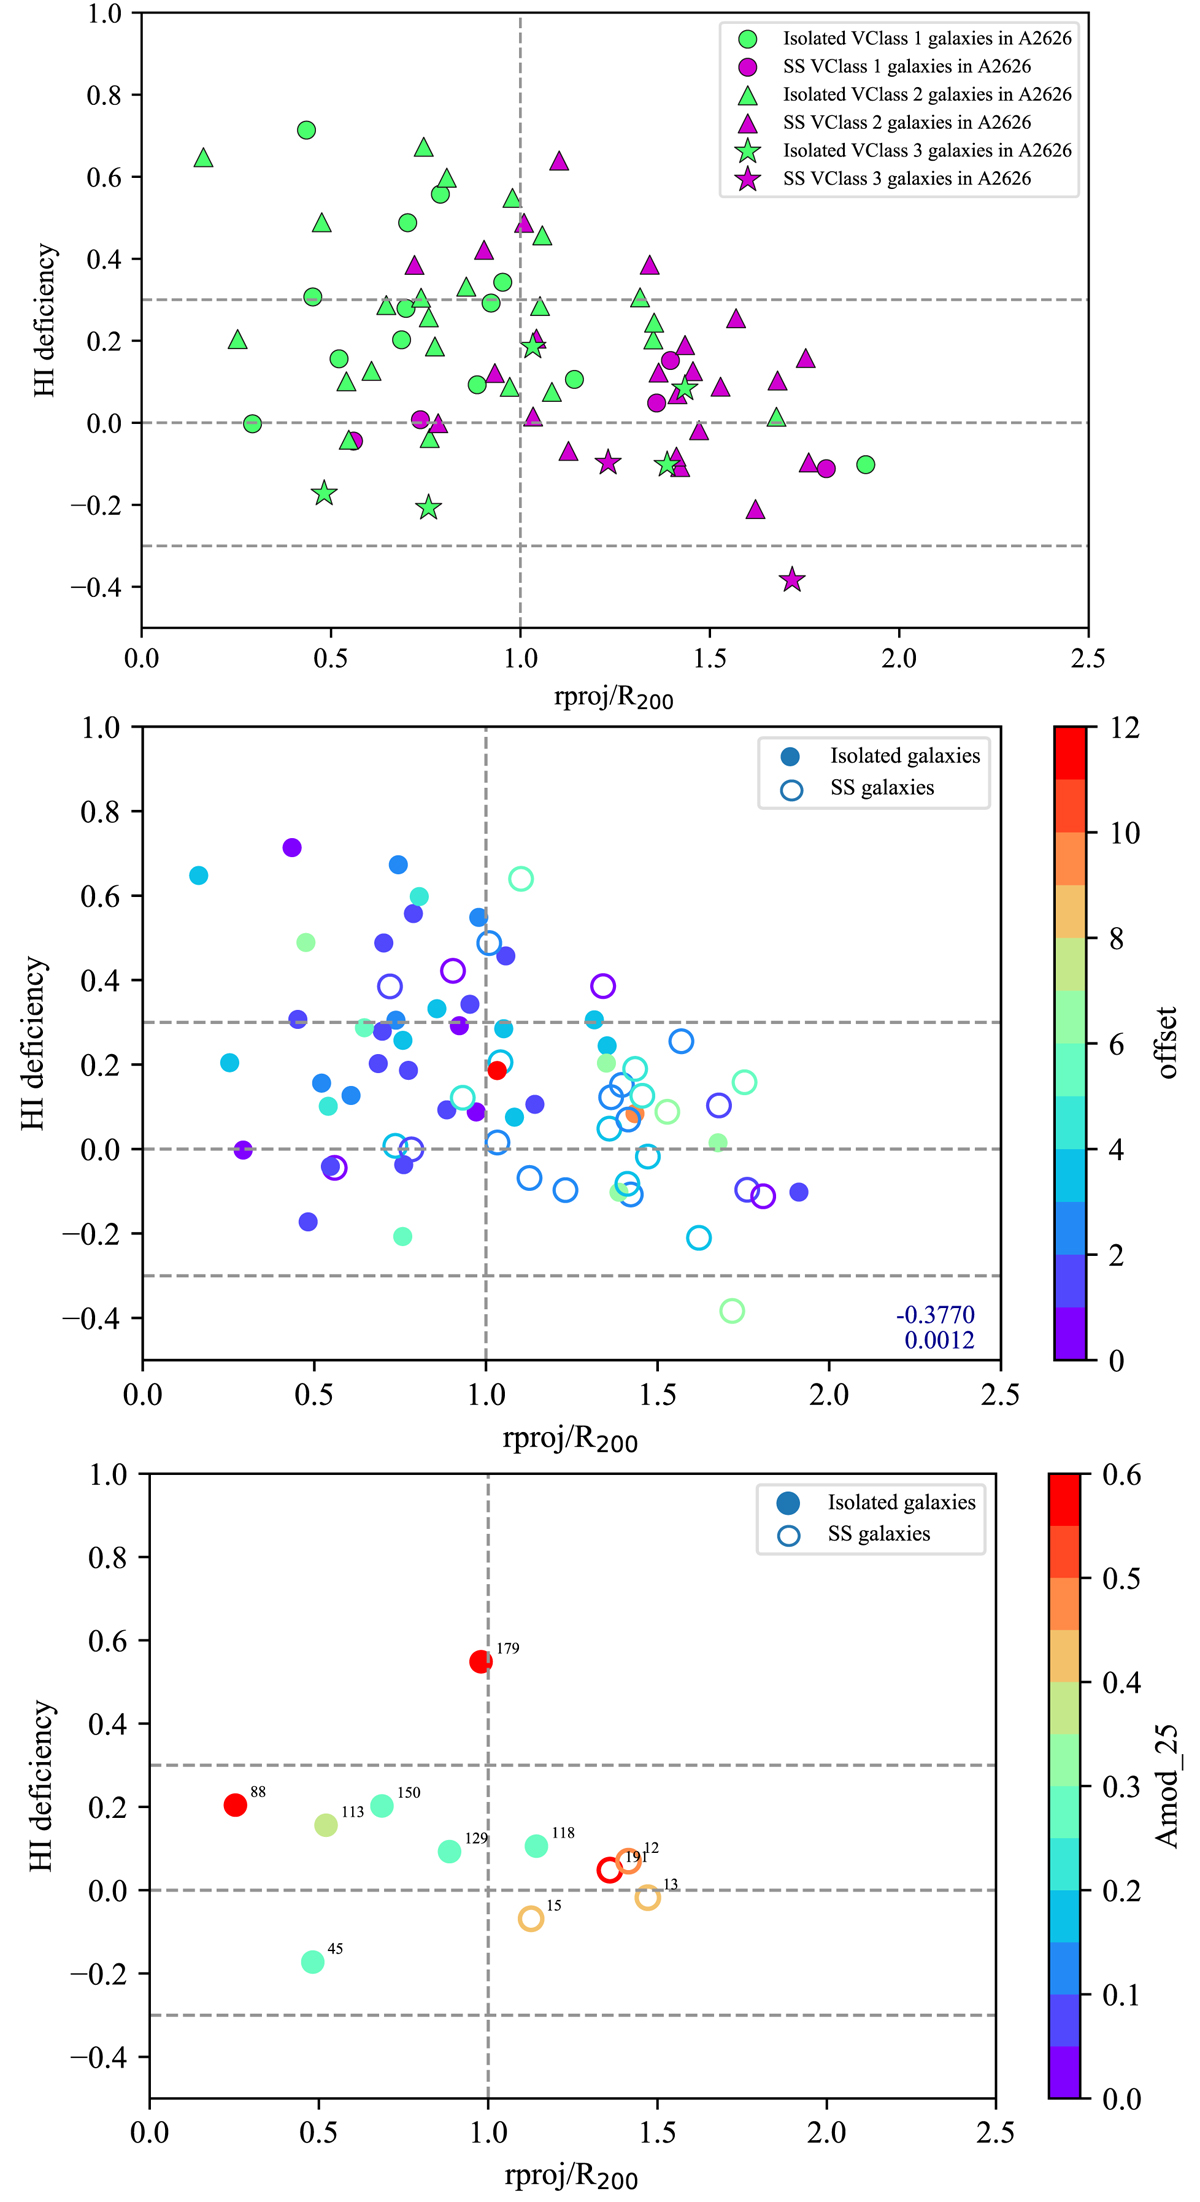
Fig. 8.
Download original image
H I deficiency vs. projected distance normalised by R200 (similar to Fig. 7), with symbols and colour codes to include additional information regarding H I morphologies of galaxies in A2626. Top panel: different symbols (shown in the top right corner) represent non-substructure (green) and substructure (magenta) galaxies of different visual classes. Middle panel: colour scale (colour bar shown on the right) representing H I offsets of non-substructure (filled circles) and substructure (open circles) galaxies. Bottom panel: colour scale (colour bar shown on the right) representing the Amod value of non-substructure (filled circles) and substructure (open circles) galaxies.
Current usage metrics show cumulative count of Article Views (full-text article views including HTML views, PDF and ePub downloads, according to the available data) and Abstracts Views on Vision4Press platform.
Data correspond to usage on the plateform after 2015. The current usage metrics is available 48-96 hours after online publication and is updated daily on week days.
Initial download of the metrics may take a while.