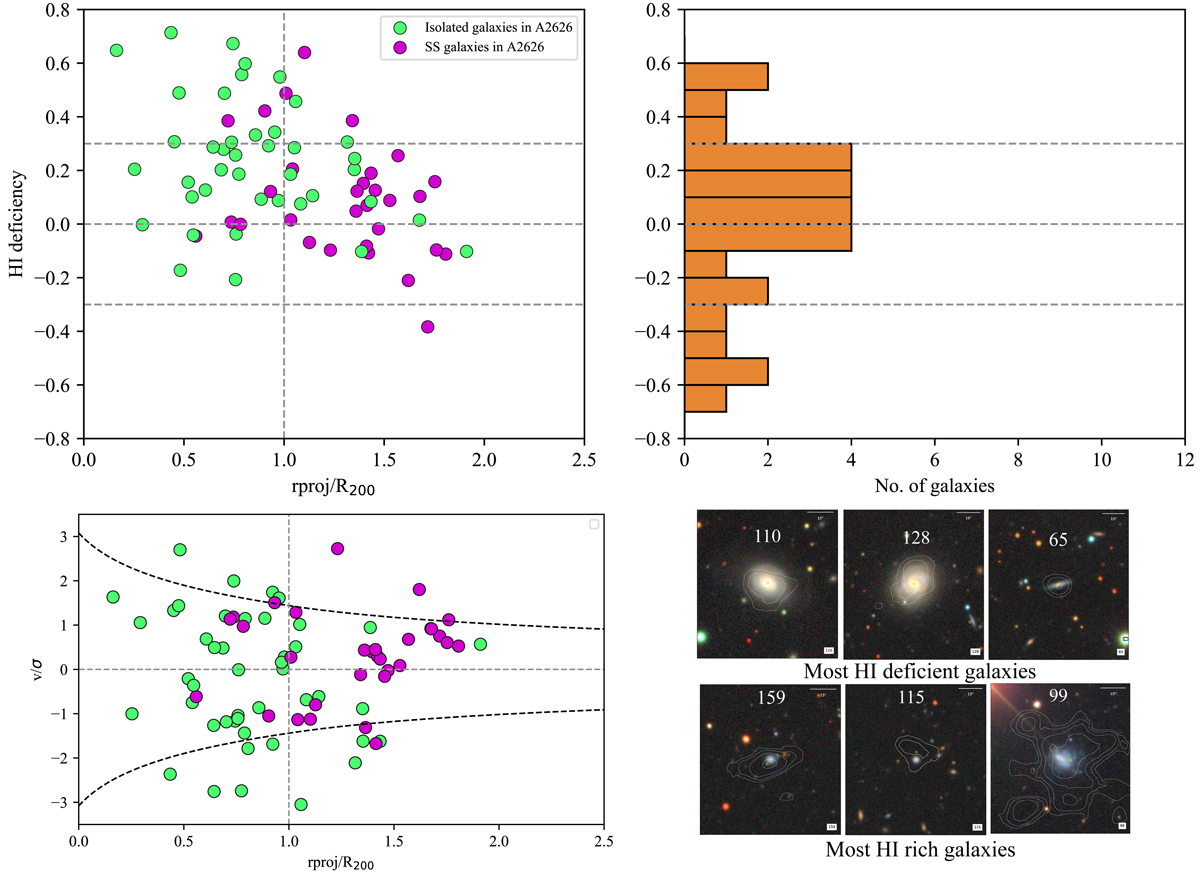
Fig. 7.
Download original image
Gas properties, velocities and morphologies of galaxies in A2626 and the Swarm. Top left: H I deficiency vs. projected distance normalised by R200 for the non-substructure (green) and substructure (magenta) galaxies in A2626. The horizontal dashed lines present the range of H I deficiencies of the field galaxies. Top right: histogram of the distribution of H I deficiencies of galaxies in the Swarm. Bottom left: distribution of the non-substructure (green) and substructure (magenta) galaxies in A2626 in projected phase-space. The dashed black lines indicate the escape velocity. Bottom right: Six H I maps overlaid on DECaLS colour images for the most H I-deficient (top three) and the most H I-rich (bottom three) galaxies. The H I-deficient galaxies seem to be bright and yellowish with an offset or truncated H I discs. The H I rich galaxies are fainter and bluish, with extended H I discs.
Current usage metrics show cumulative count of Article Views (full-text article views including HTML views, PDF and ePub downloads, according to the available data) and Abstracts Views on Vision4Press platform.
Data correspond to usage on the plateform after 2015. The current usage metrics is available 48-96 hours after online publication and is updated daily on week days.
Initial download of the metrics may take a while.