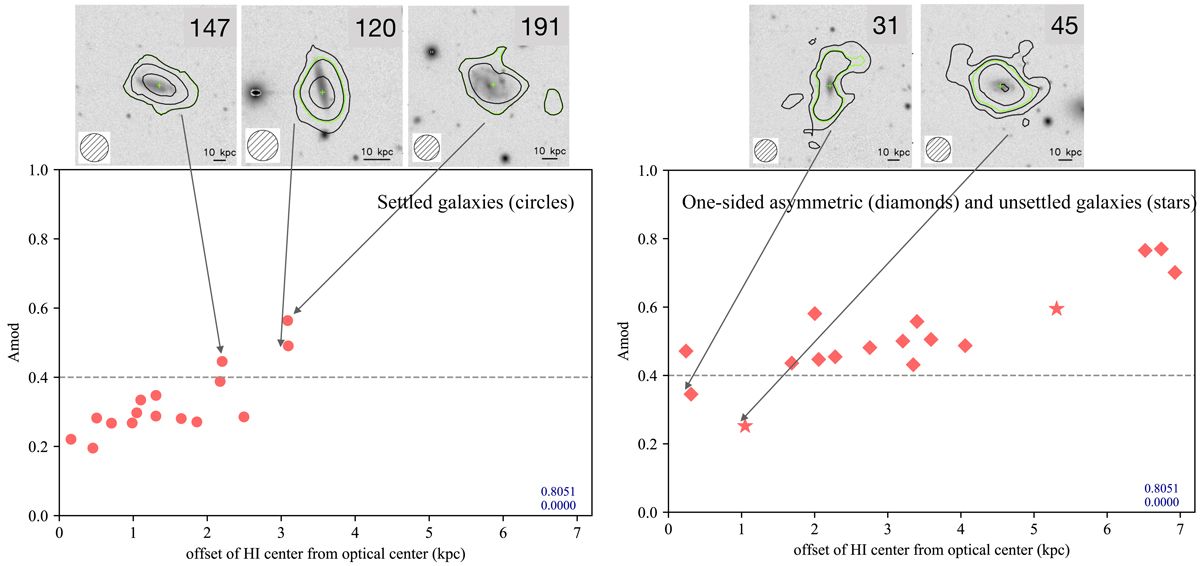
Fig. 5.
Download original image
Distribution of Amod and H I offset as a function of visual classes for the galaxies in and around A2626. Left panel: settled galaxies (circles). The top panels show H I maps of settled galaxies with high Amod. Right panel: disturbed (diamonds) and unsettled (stars) galaxies. The top panels show H I maps of disturbed and unsettled galaxies with low Amod values.
Current usage metrics show cumulative count of Article Views (full-text article views including HTML views, PDF and ePub downloads, according to the available data) and Abstracts Views on Vision4Press platform.
Data correspond to usage on the plateform after 2015. The current usage metrics is available 48-96 hours after online publication and is updated daily on week days.
Initial download of the metrics may take a while.