Open Access
Fig. 3.
Download original image
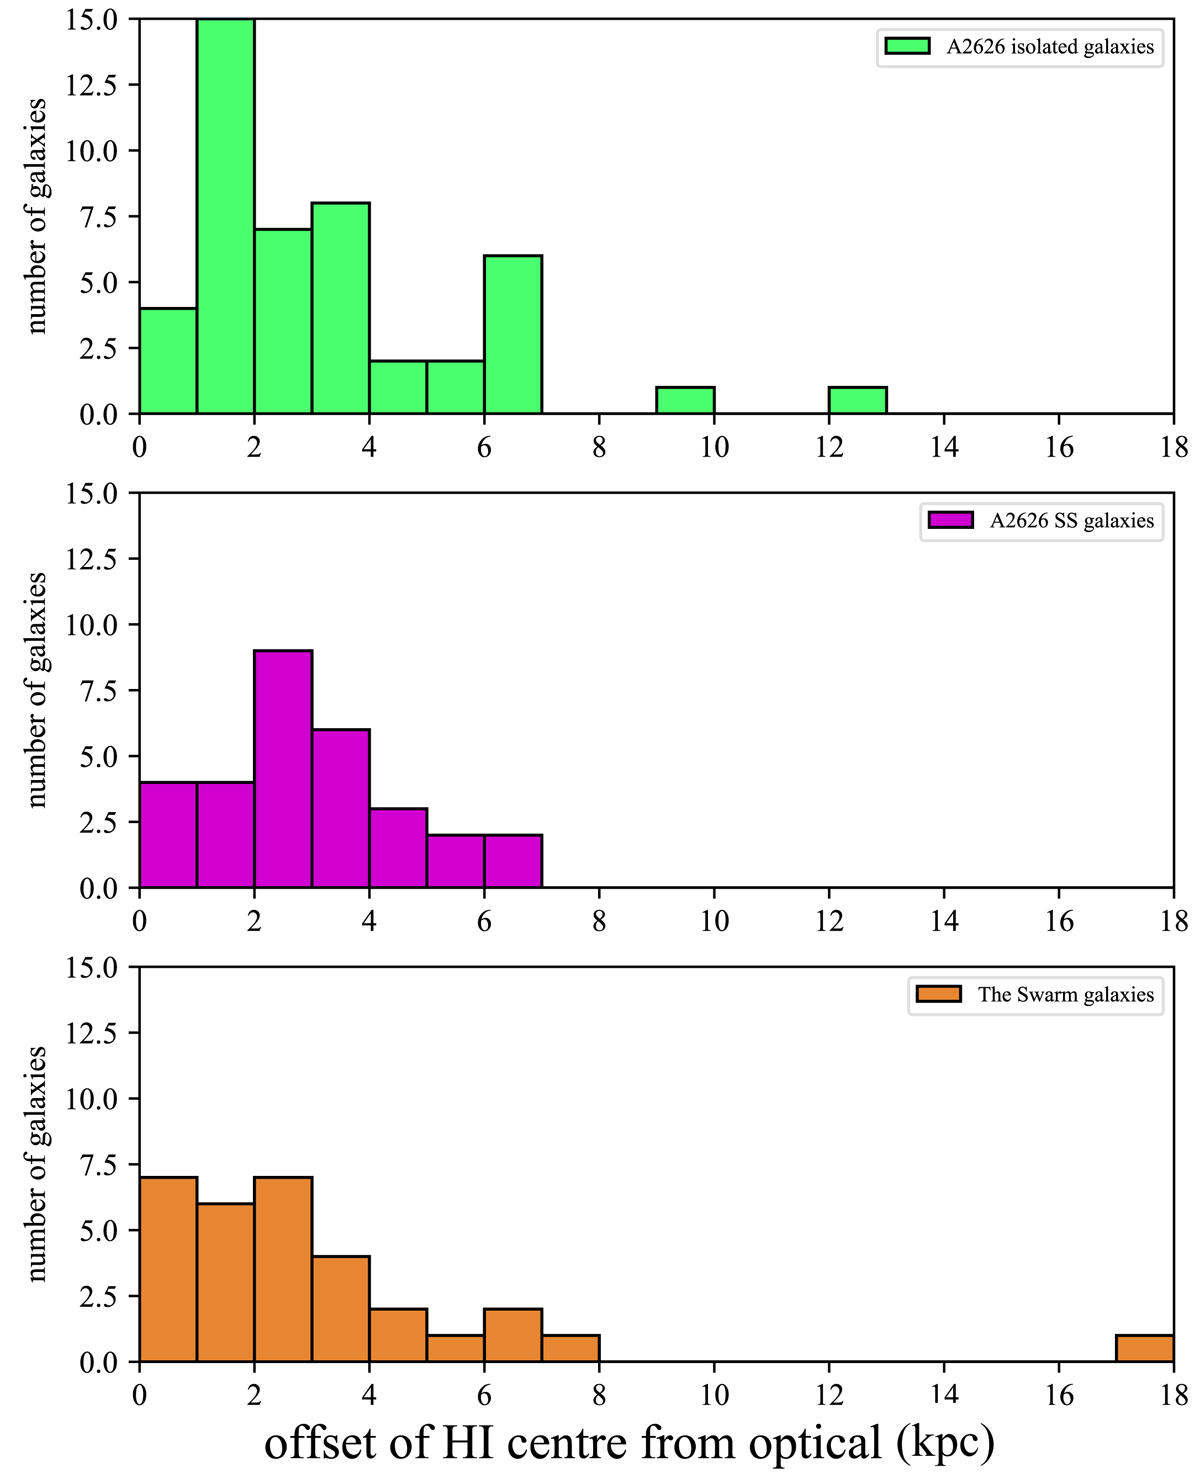
Distribution of H I offset in kiloparsec presented as histograms for the galaxies in and around A2626. The top, middle, and bottom panels show H I offsets for the non-substructure (green) and substructure (magenta) galaxies in A2626, and for the galaxies in the Swarm (orange), respectively.
Current usage metrics show cumulative count of Article Views (full-text article views including HTML views, PDF and ePub downloads, according to the available data) and Abstracts Views on Vision4Press platform.
Data correspond to usage on the plateform after 2015. The current usage metrics is available 48-96 hours after online publication and is updated daily on week days.
Initial download of the metrics may take a while.