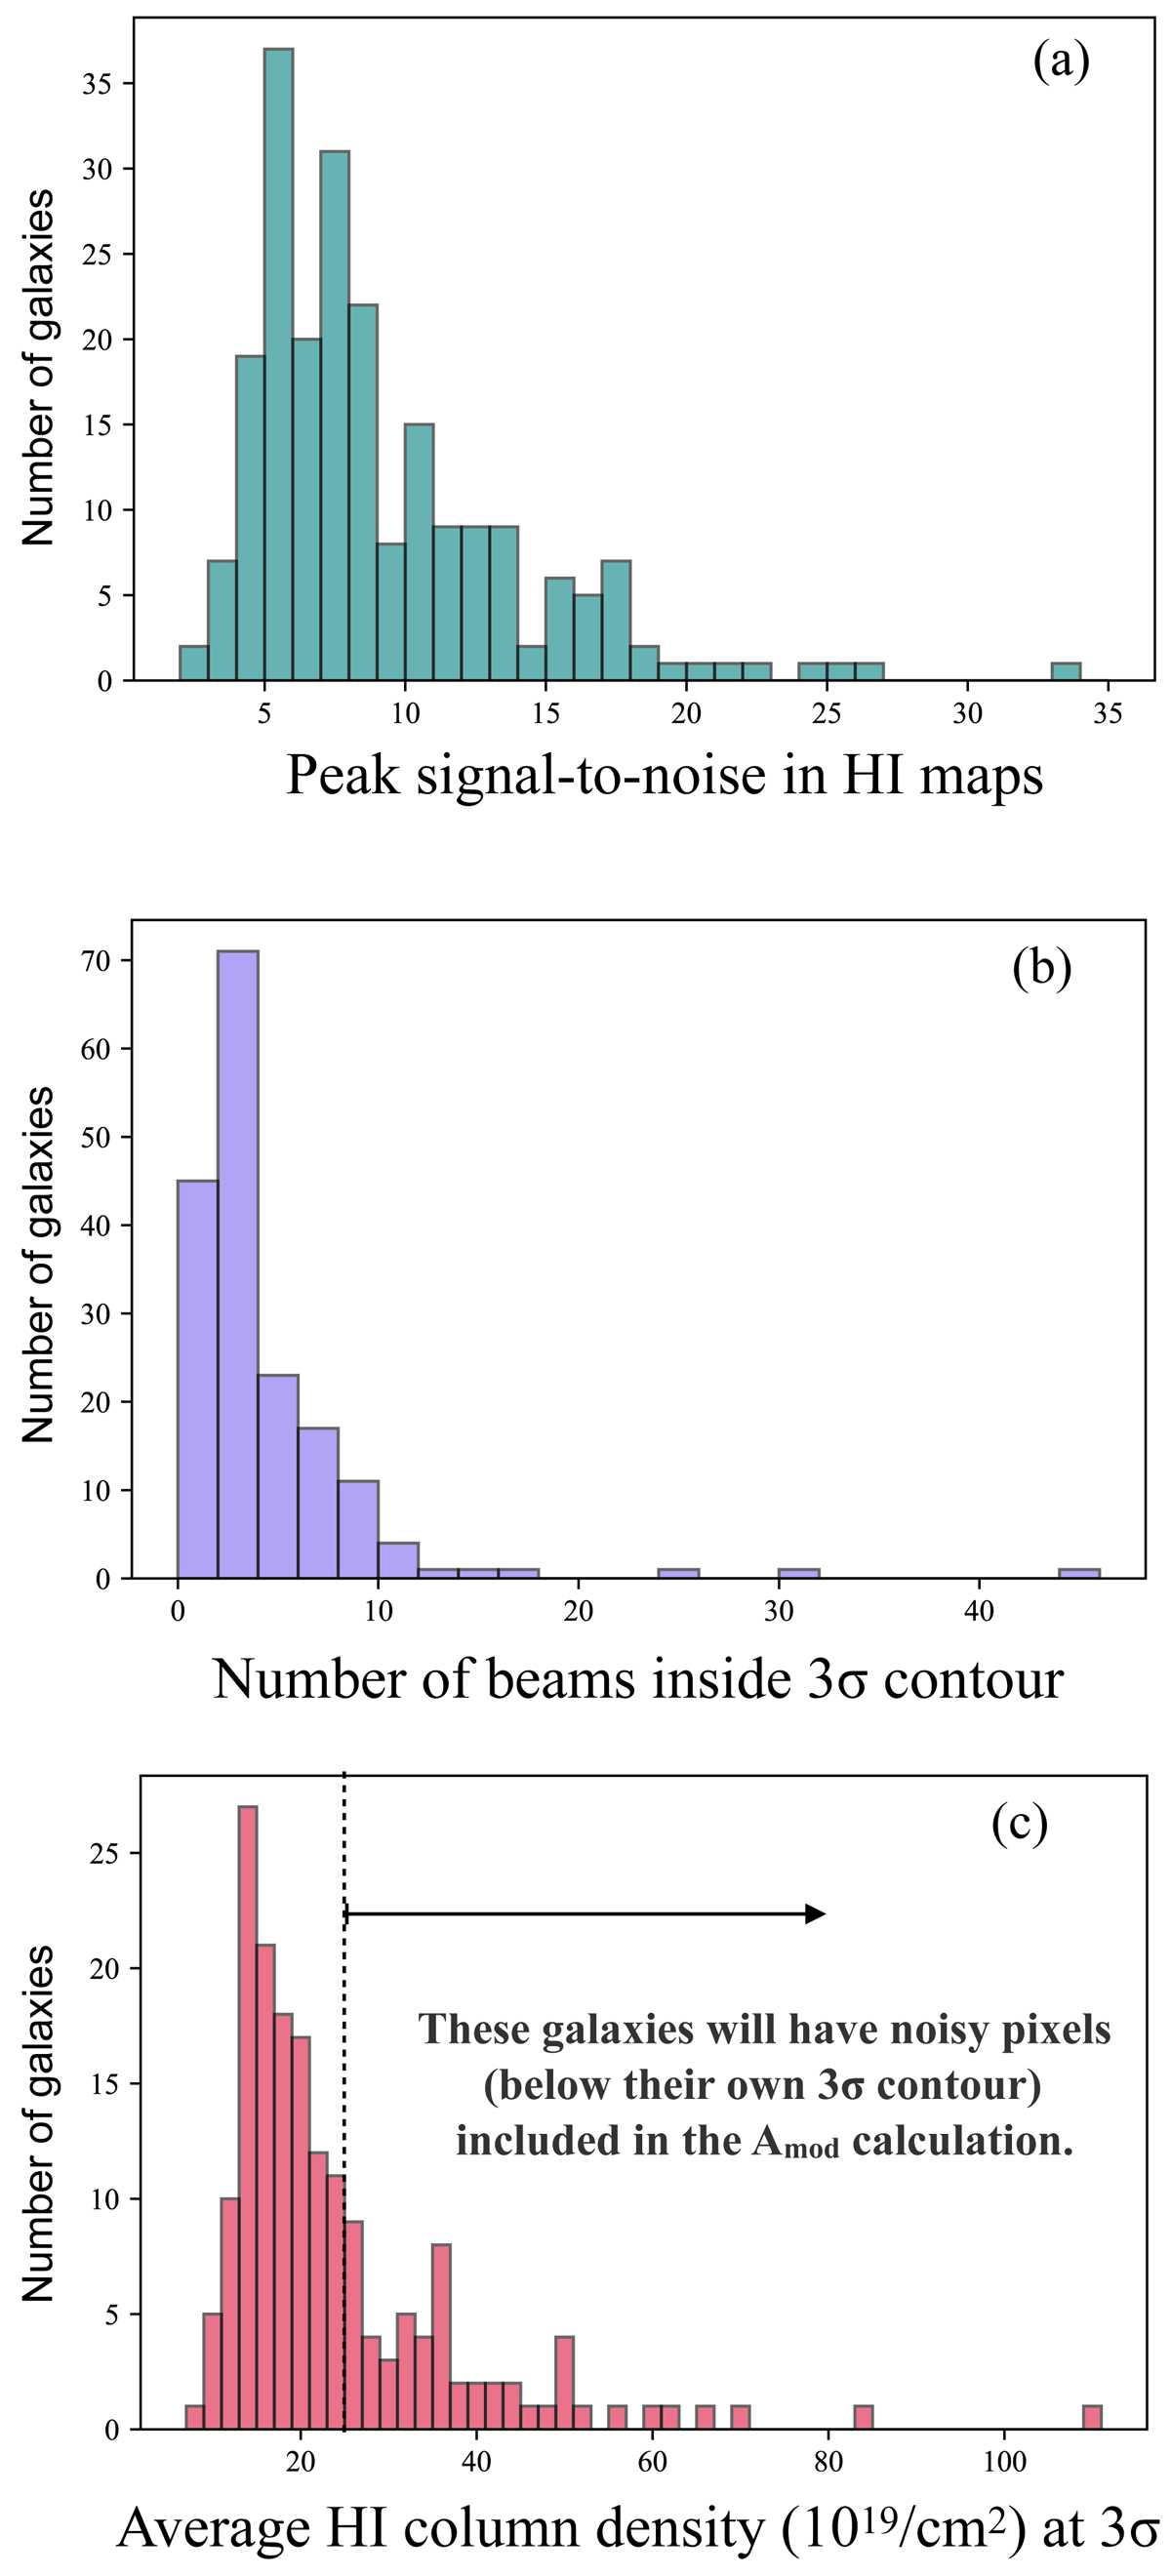
Fig. 2.
Download original image
Histograms of three observational properties of galaxies in and around A2626. (a) Distribution of the peak signal-to-noise ratio in the H I maps. (b) Number of beams enclosed by the 3σ contours of the H I maps. (c) Distribution of 3σ column density levels in the H I maps. The 3σ H I column density used here is the average column density from the signal-to-noise ratio map where the pixels with 2.5 < (S/N) < 3.5 were selected following Healy et al. (2021a).
Current usage metrics show cumulative count of Article Views (full-text article views including HTML views, PDF and ePub downloads, according to the available data) and Abstracts Views on Vision4Press platform.
Data correspond to usage on the plateform after 2015. The current usage metrics is available 48-96 hours after online publication and is updated daily on week days.
Initial download of the metrics may take a while.