Fig. 6
Download original image
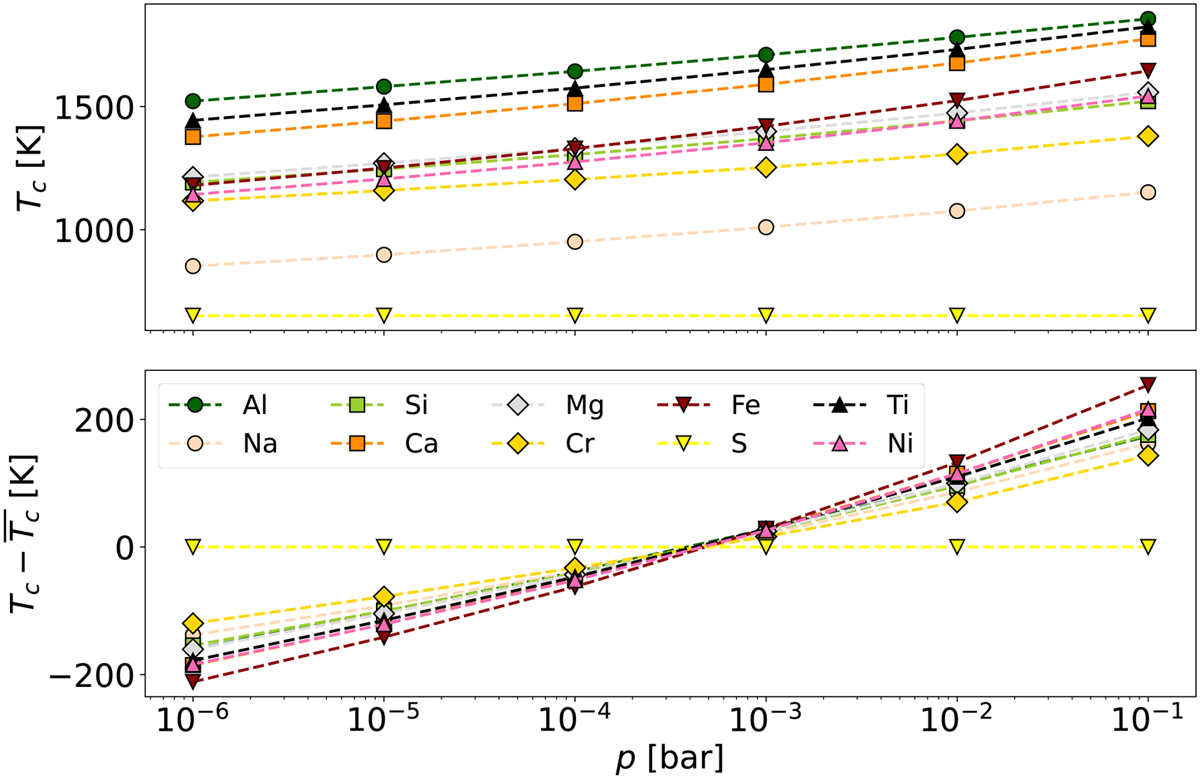
Dependence of the 50% condensation temperature (Tc) of elements on the disk pressure. Markers represent simulated condensation temperatures, and corresponding dashed lines are only to guide the eye. Colours, as denoted in the legend, are the same for both panels. All simulations use the solar elemental abundance pattern recommended by Lodders (2003). Top panel: 50% condensation temperature of major planet-building elements as a function of different disk pressures. Bottom panel: deviation of the 50% condensation temperature from the respective mean condensation temperature.
Current usage metrics show cumulative count of Article Views (full-text article views including HTML views, PDF and ePub downloads, according to the available data) and Abstracts Views on Vision4Press platform.
Data correspond to usage on the plateform after 2015. The current usage metrics is available 48-96 hours after online publication and is updated daily on week days.
Initial download of the metrics may take a while.