Fig. 3
Download original image
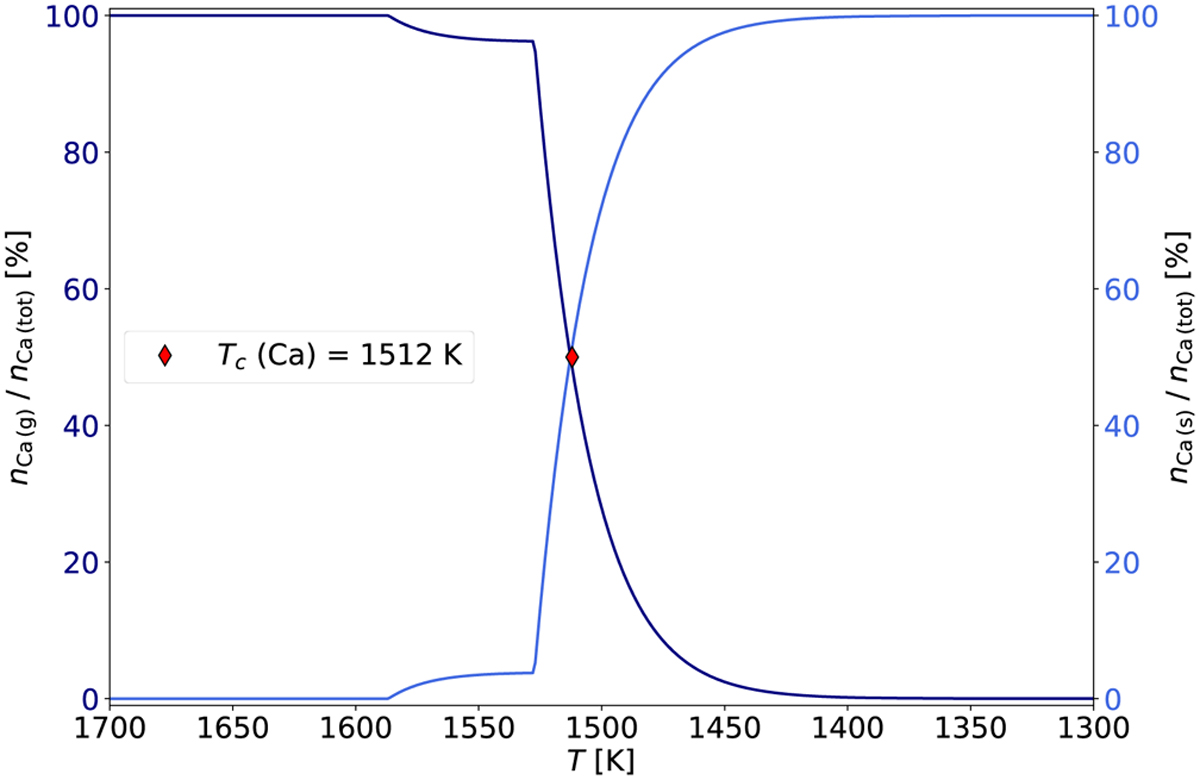
Example of the condensation curve and condensation temperature of a specific element, here Ca. The dark blue curve shows the fraction of Ca atoms bound in gas-phase species, the blue line shows the fraction of Ca atoms bound in solid-phase species. The T-value of the intersection at 50% of atoms in gas- and solid-phase signifies the 50% condensation temperature.
Current usage metrics show cumulative count of Article Views (full-text article views including HTML views, PDF and ePub downloads, according to the available data) and Abstracts Views on Vision4Press platform.
Data correspond to usage on the plateform after 2015. The current usage metrics is available 48-96 hours after online publication and is updated daily on week days.
Initial download of the metrics may take a while.