Fig. 2
Download original image
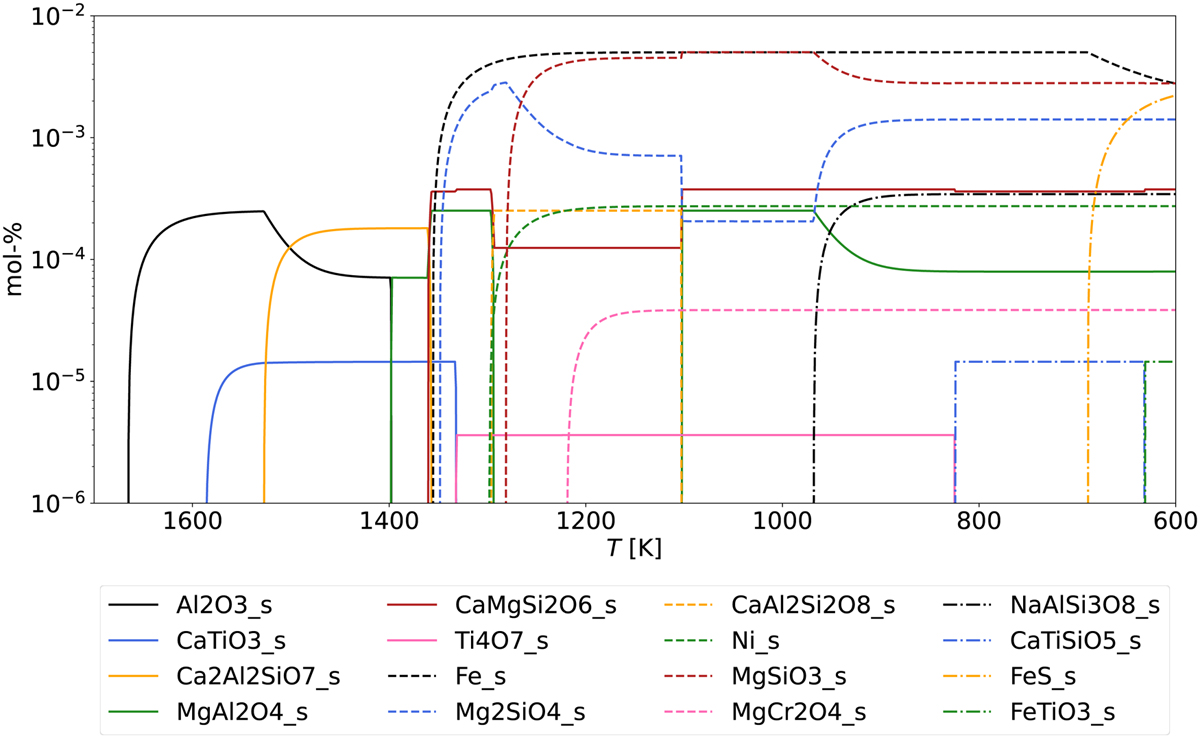
Example of the progression of solid species of a simulation. The molar amount relative to the total molar content of the disk of each of the condensates included in the simulation is shown as a function of decreasing temperature in different line colours and styles, as denoted in the legend. See Appendix D for details on the included species. The simulation was run at a constant disk pressure of p = 10−4 bar and is based the solar elemental abundance pattern recommended by Lodders (2003). See Table B.2 for a summary of the simulation parameters.
Current usage metrics show cumulative count of Article Views (full-text article views including HTML views, PDF and ePub downloads, according to the available data) and Abstracts Views on Vision4Press platform.
Data correspond to usage on the plateform after 2015. The current usage metrics is available 48-96 hours after online publication and is updated daily on week days.
Initial download of the metrics may take a while.