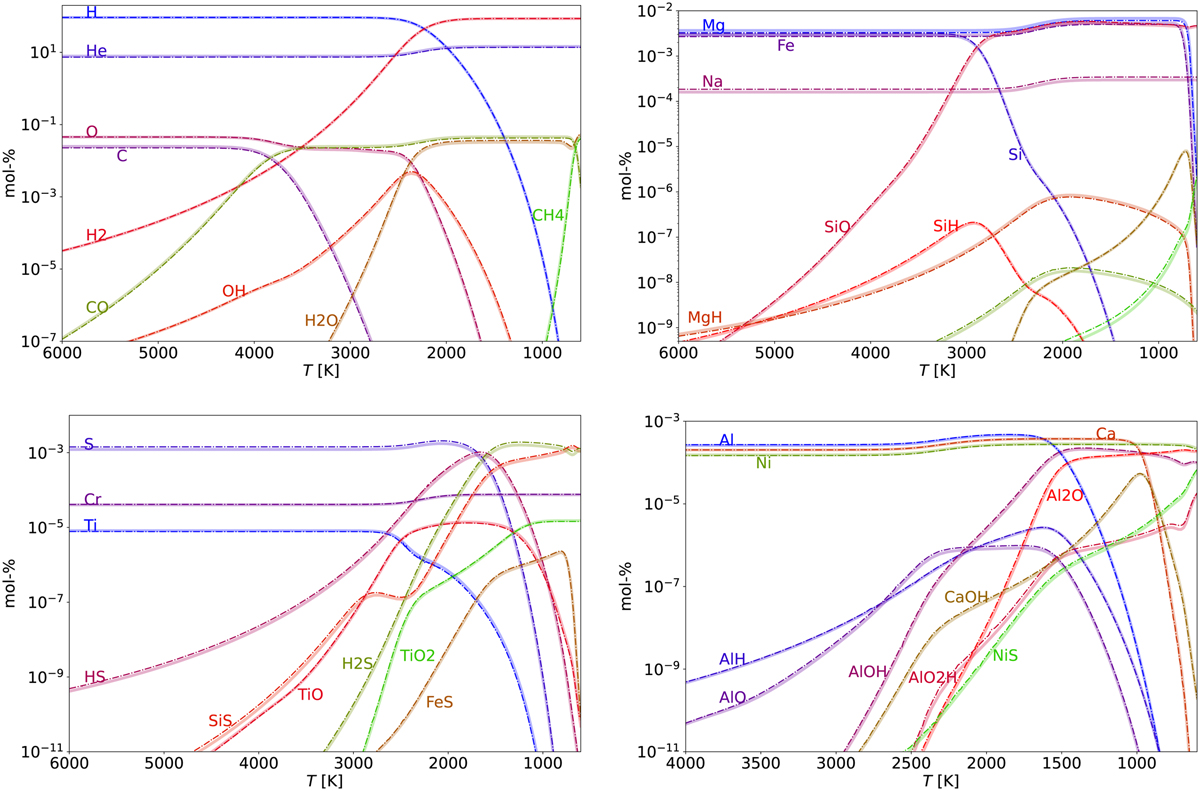
Fig. C.1
Download original image
Benchmark test results of a gas-phase simulation. Light solid lines show GGCHEM output. Dash-dotted lines show our output. Both simulations were run at a constant pressure of p = 10−4 bar, from Τ = 6000 K to Τ = 600 K. The GGCHEM simulation included 120 gas-phase species; our simulation included 40. There were slight differences in the elemental abundance pattern assumed in the two simulations.
Current usage metrics show cumulative count of Article Views (full-text article views including HTML views, PDF and ePub downloads, according to the available data) and Abstracts Views on Vision4Press platform.
Data correspond to usage on the plateform after 2015. The current usage metrics is available 48-96 hours after online publication and is updated daily on week days.
Initial download of the metrics may take a while.