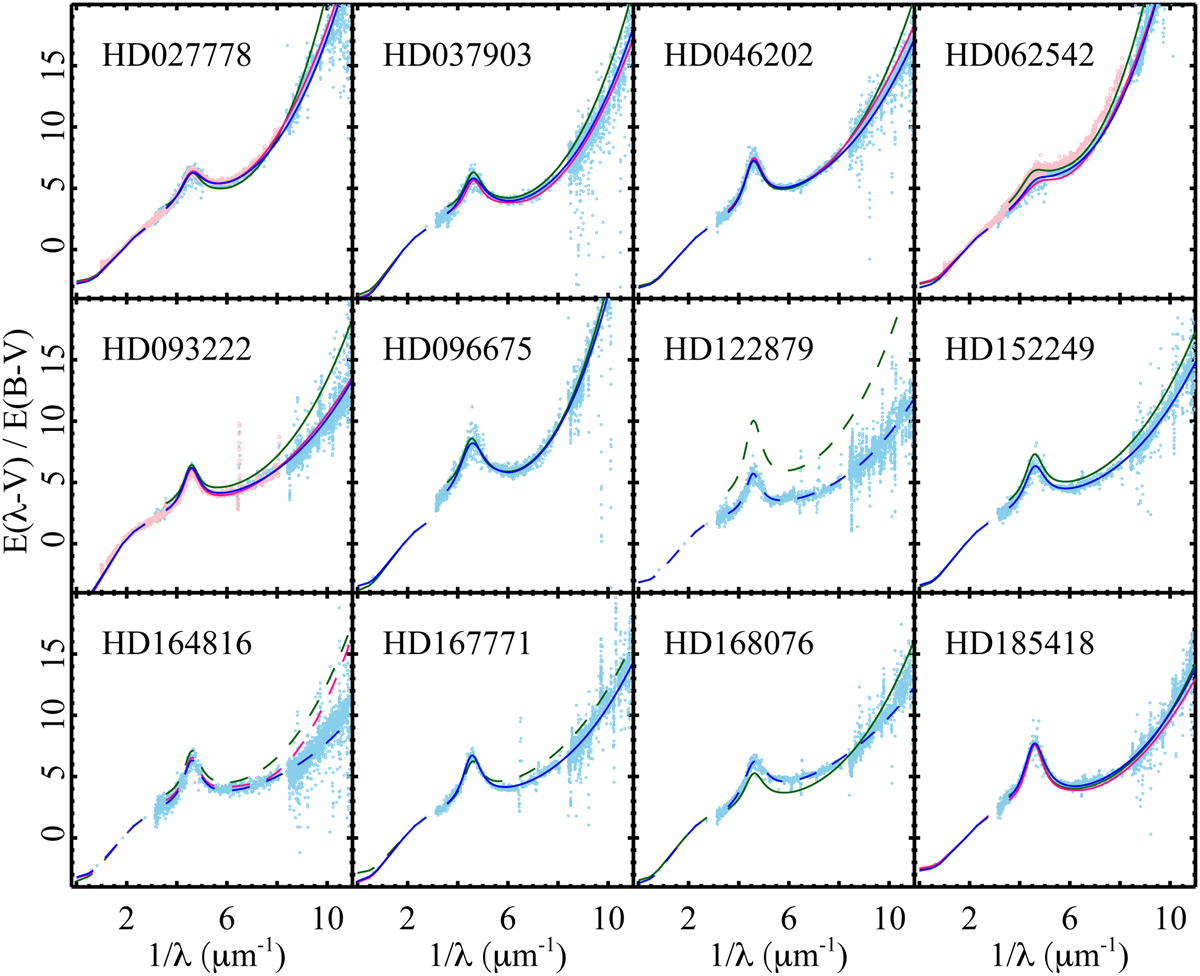
Fig. 6
Download original image
Comparison of reddening curves derived for the same sightline. The symbols represent the reddening data from Gordon et al. (2009) shown as blue dots and by Fitzpatrick et al. (2019) in salmon, respectively. Reddening curves derived from UV spline fits (Eq. (5)) and interpolated in UBVJHK, –RV are taken from Gordon et al. (2009), shown as blue, by Fitzpatrick & Massa (2007) in red, and by Valencic et al. (2004) by green lines. Non peculiar stars of the high-quality sample listed in Table 4 are shown as full lines with the others as dashed lines.
Current usage metrics show cumulative count of Article Views (full-text article views including HTML views, PDF and ePub downloads, according to the available data) and Abstracts Views on Vision4Press platform.
Data correspond to usage on the plateform after 2015. The current usage metrics is available 48-96 hours after online publication and is updated daily on week days.
Initial download of the metrics may take a while.