Open Access
Fig. 5
Download original image
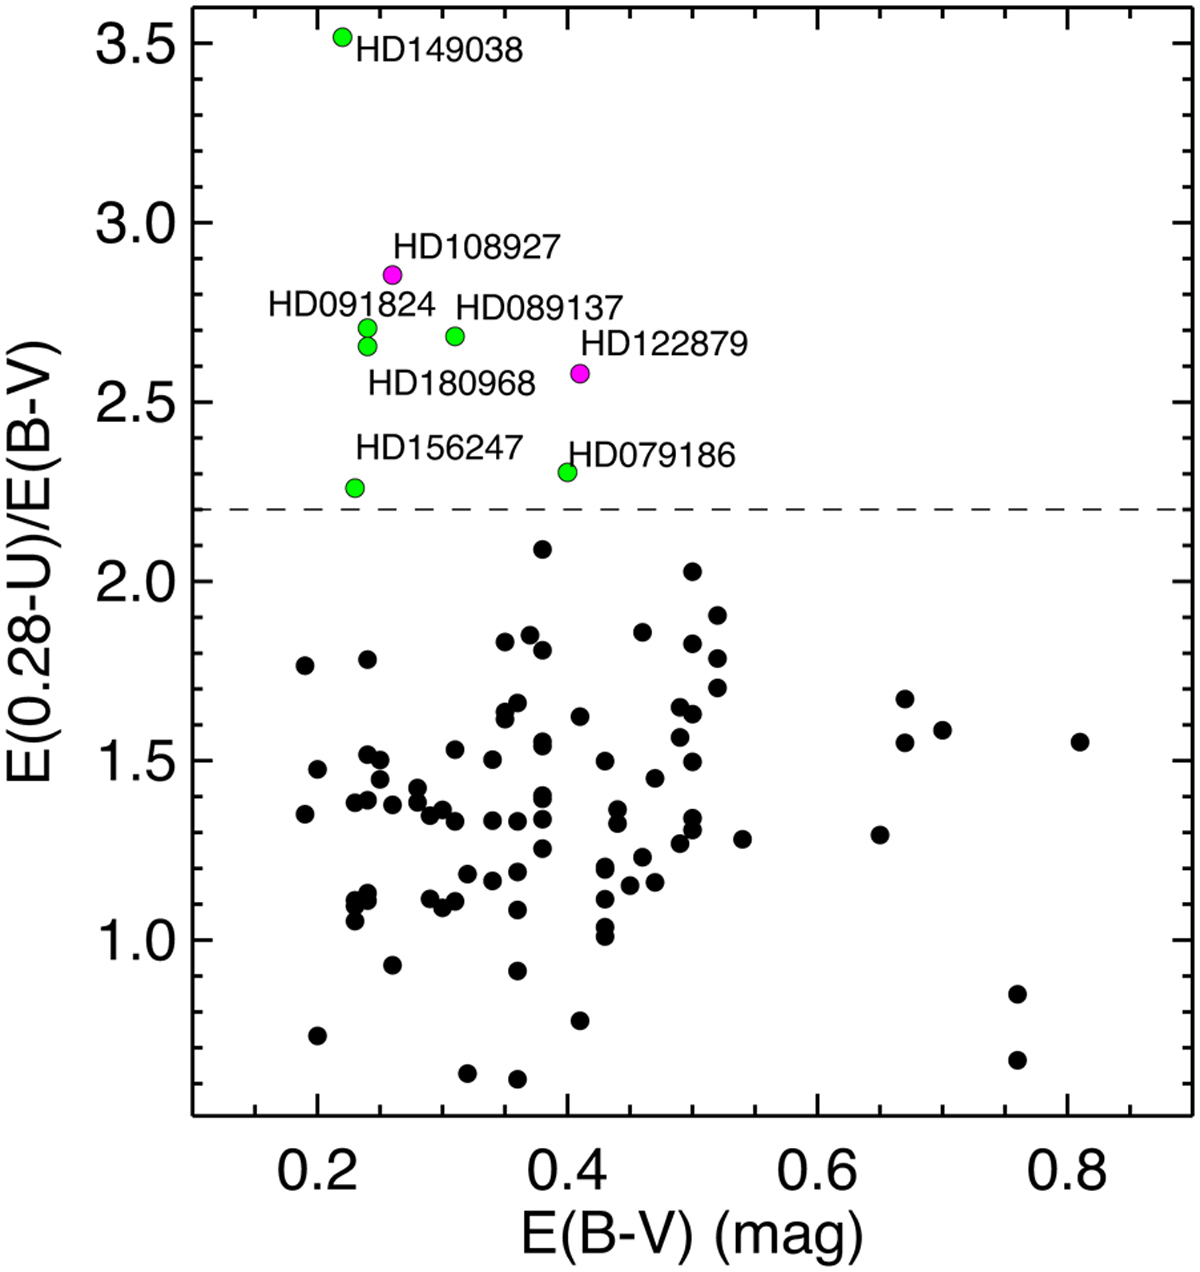
Reddening between 0.28 µm and the U band as a function of E(B – V). The reddening curves towards the stars above the dashed line were derived by Valencic et al. (2004). They are marked in green when included in the high-quality sample (Table 4) and in red when rejected.
Current usage metrics show cumulative count of Article Views (full-text article views including HTML views, PDF and ePub downloads, according to the available data) and Abstracts Views on Vision4Press platform.
Data correspond to usage on the plateform after 2015. The current usage metrics is available 48-96 hours after online publication and is updated daily on week days.
Initial download of the metrics may take a while.