| Issue |
A&A
Volume 676, August 2023
|
|
|---|---|---|
| Article Number | C2 | |
| Number of page(s) | 2 | |
| Section | Letters to the Editor | |
| DOI | https://doi.org/10.1051/0004-6361/202244547e | |
| Published online | 31 July 2023 | |
GBT/MUSTANG-2 900 resolution imaging of the SZ effect in MS0735.6+7421
Confirmation of the SZ cavities through direct imaging (Corrigendum)
1
Department of Physics and Astronomy, University of Pennsylvania, 209 South 33rd Street, Philadelphia, PA, 19104
USA
e-mail: This email address is being protected from spambots. You need JavaScript enabled to view it.
2
Department of Physics, University of Trieste, via Tiepolo 11, 34131 Trieste, Italy
3
INAF–Osservatorio Astronomico di Trieste, via Tiepolo 11, 34131 Trieste, Italy
4
IFPU–Institute for Fundamental Physics of the Universe, via Beirut 2, 34014 Trieste, Italy
5
Center for Astrophysics | Harvard and Smithsonian, 60 Garden Street, Cambridge, MA, 02143
USA
6
European Southern Observatory (ESO), Karl-Schwarzschild-Strasse 2, 85741 Garching, Germany
7
Max Planck Institute for Astrophysics, Karl-Schwarzschild-Strasse 1, 85741 Garching, Germany
8
Space Research Institute (IKI), Profsoyuznaya 84/32, Moscow, 117997
Russia
9
Naval Research Laboratory, Code 7213, 4555 Overlook Ave SW, Washington, DC, 20375
USA
10
Department of Astrophysical Sciences, Princeton University, Princeton, NJ, 08544
USA
11
Department of Astronomy, University of Arizona, Tucson, AZ, 85721
USA
12
NRAO, 520 Edgemont Rd, Charlottesville, VA, 22903
USA
13
Department of Astronomy, University of Virginia, 530 McCormick Road, Charlottesville, VA, 22904-4325
USA
14
Department of Physics, McGill University, 3600 University Street, Montreal, QC, H3A 2T8
Canada
Key words: galaxies: clusters: individual: MS0735.6+7421 / galaxies: clusters: intracluster medium / cosmic background radiation / errata / addenda
In the course of refactoring the code used to perform model fitting in Orlowski-Scherer et al. (2022), it was discovered that the beam size used was incorrect. MUSTANG-2 uses two concentric Gaussian beam profiles to represent the inner beam and the extended wings (e.g. Romero et al. 2020). For each of the Gaussians, the amplitude of the Gaussian and its full width at half maximum had been swapped. This resulted in incorrect smoothing of the map. We have completely rerun the analysis using the more accurate beam. There are no significant changes to our results. In general, the suppression factors, f, increase by about 1σ from the values quoted in Orlowski-Scherer et al. (2022), but remain consistent with either non-thermal pressure support or a mixture of extremely hot thermal and non-thermal support. In fact, our results are less consistent with purely thermal support, although we still cannot completely rule out pure thermal support. Additionally, we no longer find statistically significant support for an outer profile slope, β1, which differs from the X-ray-inferred value from Vantyghem et al. (2014) when not performing time ordered data (TOD) subtraction; this is a very minor change. In this erratum we include updated versions of all the tables and plots that were affected by this bug.
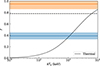 |
Fig. 1. Updated plot of the suppression factor, f, vs. kT for the thermal support case. This is an updated version of Fig. 2 in the original paper, with the values of f updated; the theory curves are the same. f = 1 means complete suppression, i.e., no SZ signal from the bubbles, while f = 0 means no suppression, i.e., the signal within the bubble is identical to the global ICM signal. The blue band shows the best-fit f with 1σ uncertainties for the lowest f case considered, corresponding to thermal pressure support by electrons with temperatures of at least 110 keV. The dashed line shows the lowest value consistent with Abdulla et al. (2019) to 1σ. |
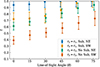 |
Fig. 2. Updated plot of the suppression factor, f, as a function of the line-of-sight angle, with θ = 0 being in the plane of the sky and θ = 90 lying along the z-axis. This is an updated version of Fig. 3 from the original paper, with updated values for f. Shown is the f for both the northeast and southwest cavities for the scenarios in Table 1 that include shocks with the highest and lowest suppression factors. Explicitly, they are: with shock, r3 = r1, and with TOD subtraction; and with shock, r3 = r2, and without TOD subtraction. In general, f increases with increasing θ, although we do not completely lose our ability to distinguish between pressure support scenarios, e.g., we can still rule out f = 1 for the southwest cavity in the r3 = r2 without TOD subtraction. |
Updated summary of the results of the various fitting routines we completed.
In general, using this improved representation of the MUSTANG-2 beam has not changed the results of Orlowski-Scherer et al. (2022). The exact suppression factors have changed slightly, however, and as such we report them here. These new suppression factors should be used instead of those found in Orlowski-Scherer et al. (2022).
Updated statistical significance of the improvement of fit as determined by an F-test for freeing the outer slope, β1, for various combinations of TOD subtraction and r3 values. This is the equivalent of Table 4 in the original Letter. Values for β1 and the significance of detection have been updated here. This includes the only substantive update from this erratum; the detections without TOD subtraction are no longer statistically significant. In general, the fit is improved at a statistically significant level when performing TOD subtraction, but did not improve without it. This is indicative of a degeneracy between the bowling of the maps and β1.
Updated statistical significance of the improvement of fit as determined by an F-test for adding the shock enhancement for various combinations of TOD subtraction and r3 values. This is an updated version of Table 5 of the original work. Values of ℳ and their significances have been updated. The inclusion is very statistically significant when TOD subtraction is performed, but marginal when it is not. This may be because the bowling is of comparable scale to the shock, and hence without TOD subtraction we have difficulty detecting the shock.
References
- Abdulla, Z., Carlstrom, J. E., Mantz, A. B., et al. 2019, ApJ, 871, 195 [NASA ADS] [CrossRef] [Google Scholar]
- Orlowski-Scherer, J., Haridas, S. K., Di Mascolo, L., et al. 2022, A&A, 667, L6 [NASA ADS] [CrossRef] [EDP Sciences] [Google Scholar]
- Romero, C. E., Sievers, J., Ghirardini, V., et al. 2020, ApJ, 891, 90 [NASA ADS] [CrossRef] [Google Scholar]
- Vantyghem, A. N., McNamara, B. R., Russell, H. R., et al. 2014, MNRAS, 442, 3192 [Google Scholar]
© The Authors 2023
 Open Access article, published by EDP Sciences, under the terms of the Creative Commons Attribution License (https://creativecommons.org/licenses/by/4.0), which permits unrestricted use, distribution, and reproduction in any medium, provided the original work is properly cited.
This article is published in open access under the Subscribe to Open model. This email address is being protected from spambots. You need JavaScript enabled to view it. to support open access publication.
All Tables
Updated statistical significance of the improvement of fit as determined by an F-test for freeing the outer slope, β1, for various combinations of TOD subtraction and r3 values. This is the equivalent of Table 4 in the original Letter. Values for β1 and the significance of detection have been updated here. This includes the only substantive update from this erratum; the detections without TOD subtraction are no longer statistically significant. In general, the fit is improved at a statistically significant level when performing TOD subtraction, but did not improve without it. This is indicative of a degeneracy between the bowling of the maps and β1.
Updated statistical significance of the improvement of fit as determined by an F-test for adding the shock enhancement for various combinations of TOD subtraction and r3 values. This is an updated version of Table 5 of the original work. Values of ℳ and their significances have been updated. The inclusion is very statistically significant when TOD subtraction is performed, but marginal when it is not. This may be because the bowling is of comparable scale to the shock, and hence without TOD subtraction we have difficulty detecting the shock.
All Figures
|
Fig. 1. Updated plot of the suppression factor, f, vs. kT for the thermal support case. This is an updated version of Fig. 2 in the original paper, with the values of f updated; the theory curves are the same. f = 1 means complete suppression, i.e., no SZ signal from the bubbles, while f = 0 means no suppression, i.e., the signal within the bubble is identical to the global ICM signal. The blue band shows the best-fit f with 1σ uncertainties for the lowest f case considered, corresponding to thermal pressure support by electrons with temperatures of at least 110 keV. The dashed line shows the lowest value consistent with Abdulla et al. (2019) to 1σ. |
| In the text | |
|
Fig. 2. Updated plot of the suppression factor, f, as a function of the line-of-sight angle, with θ = 0 being in the plane of the sky and θ = 90 lying along the z-axis. This is an updated version of Fig. 3 from the original paper, with updated values for f. Shown is the f for both the northeast and southwest cavities for the scenarios in Table 1 that include shocks with the highest and lowest suppression factors. Explicitly, they are: with shock, r3 = r1, and with TOD subtraction; and with shock, r3 = r2, and without TOD subtraction. In general, f increases with increasing θ, although we do not completely lose our ability to distinguish between pressure support scenarios, e.g., we can still rule out f = 1 for the southwest cavity in the r3 = r2 without TOD subtraction. |
| In the text | |
Current usage metrics show cumulative count of Article Views (full-text article views including HTML views, PDF and ePub downloads, according to the available data) and Abstracts Views on Vision4Press platform.
Data correspond to usage on the plateform after 2015. The current usage metrics is available 48-96 hours after online publication and is updated daily on week days.
Initial download of the metrics may take a while.