Fig. 7.
Download original image
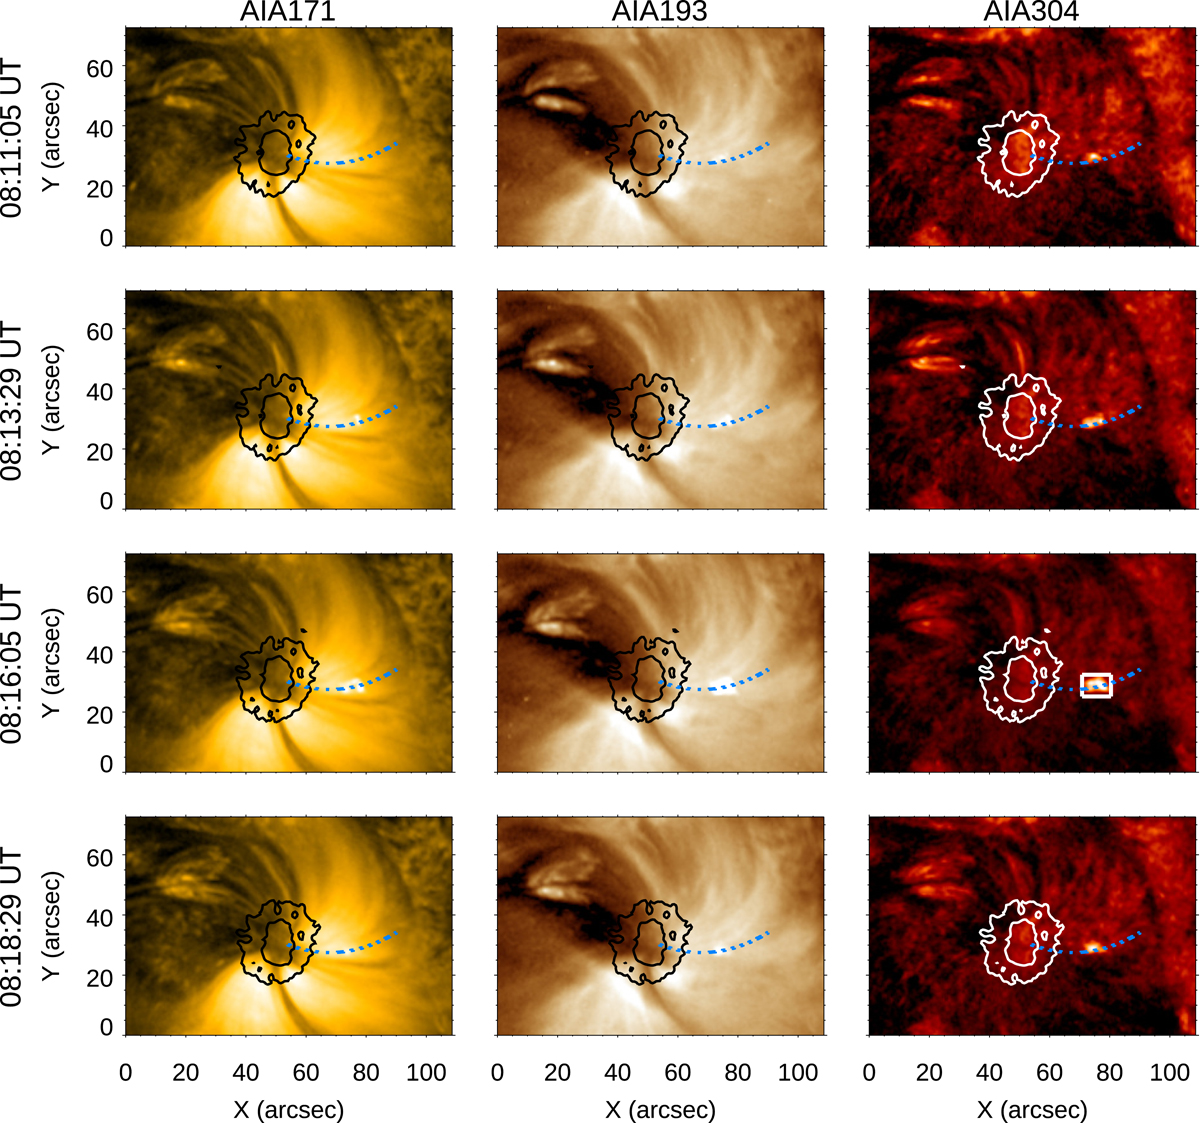
EUV observations of the sunspot. Each column corresponds to a different AIA filter (from left to right: 171 Å, 193 Å, and 304 Å). Rows represent different times, with the time indicated at the left-hand side. Black and white lines illustrate the umbra and penumbra boundaries as selected from contours of constant intensity in AIA 1700 Å. The dotted blue line traces the coronal loop illustrated in Fig. 8. The white square delimits the region used for the average plotted in Fig. 9.
Current usage metrics show cumulative count of Article Views (full-text article views including HTML views, PDF and ePub downloads, according to the available data) and Abstracts Views on Vision4Press platform.
Data correspond to usage on the plateform after 2015. The current usage metrics is available 48-96 hours after online publication and is updated daily on week days.
Initial download of the metrics may take a while.